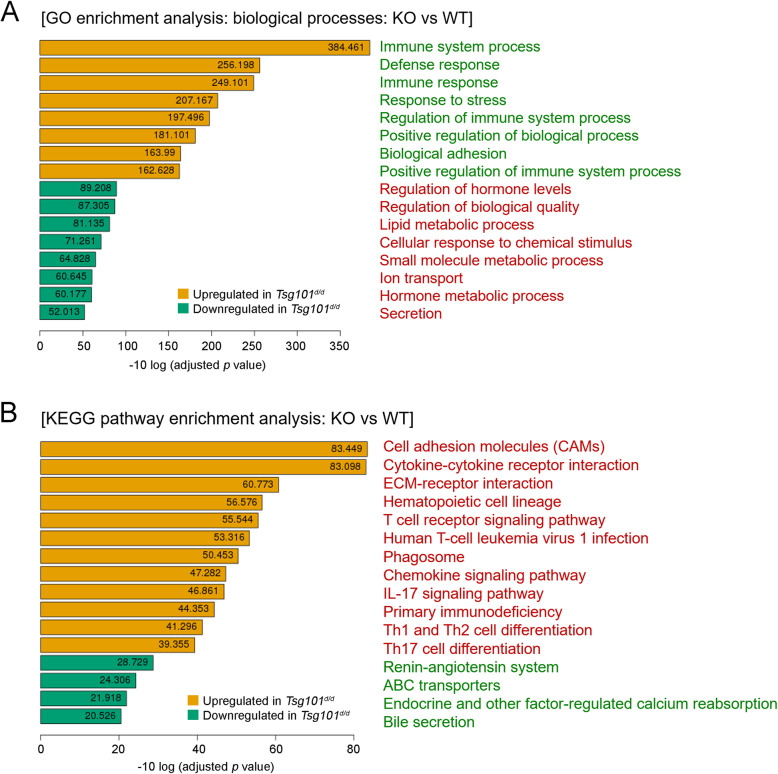
Fig. 7.
Pathway analyses of gene expression profiles. (A) Gene Ontology (GO) term enrichment analysis of biological processes for upregulated and downregulated DEGs between the Tsg101f/f and Tsg101d/d UECs. Top 16 GO terms associated with the biological processes are shown. The X-axis corresponds to the mean expression value of negative log 10 (adjusted p value). (B) Kyoto Encyclopedia of Genes and Genomes (KEGG) pathway enrichment analysis for the upregulated and downregulated genes between the Tsg101f/f and Tsg101d/d UECs. Gene expression information was mapped to the KEGG pathway and the top 12 significantly upregulated and the top 4 downregulated pathways are shown. The X-axis corresponds to the mean expression value of negative log 10 (adjusted p value)

