
Figure 5. State-dependent structural changes.
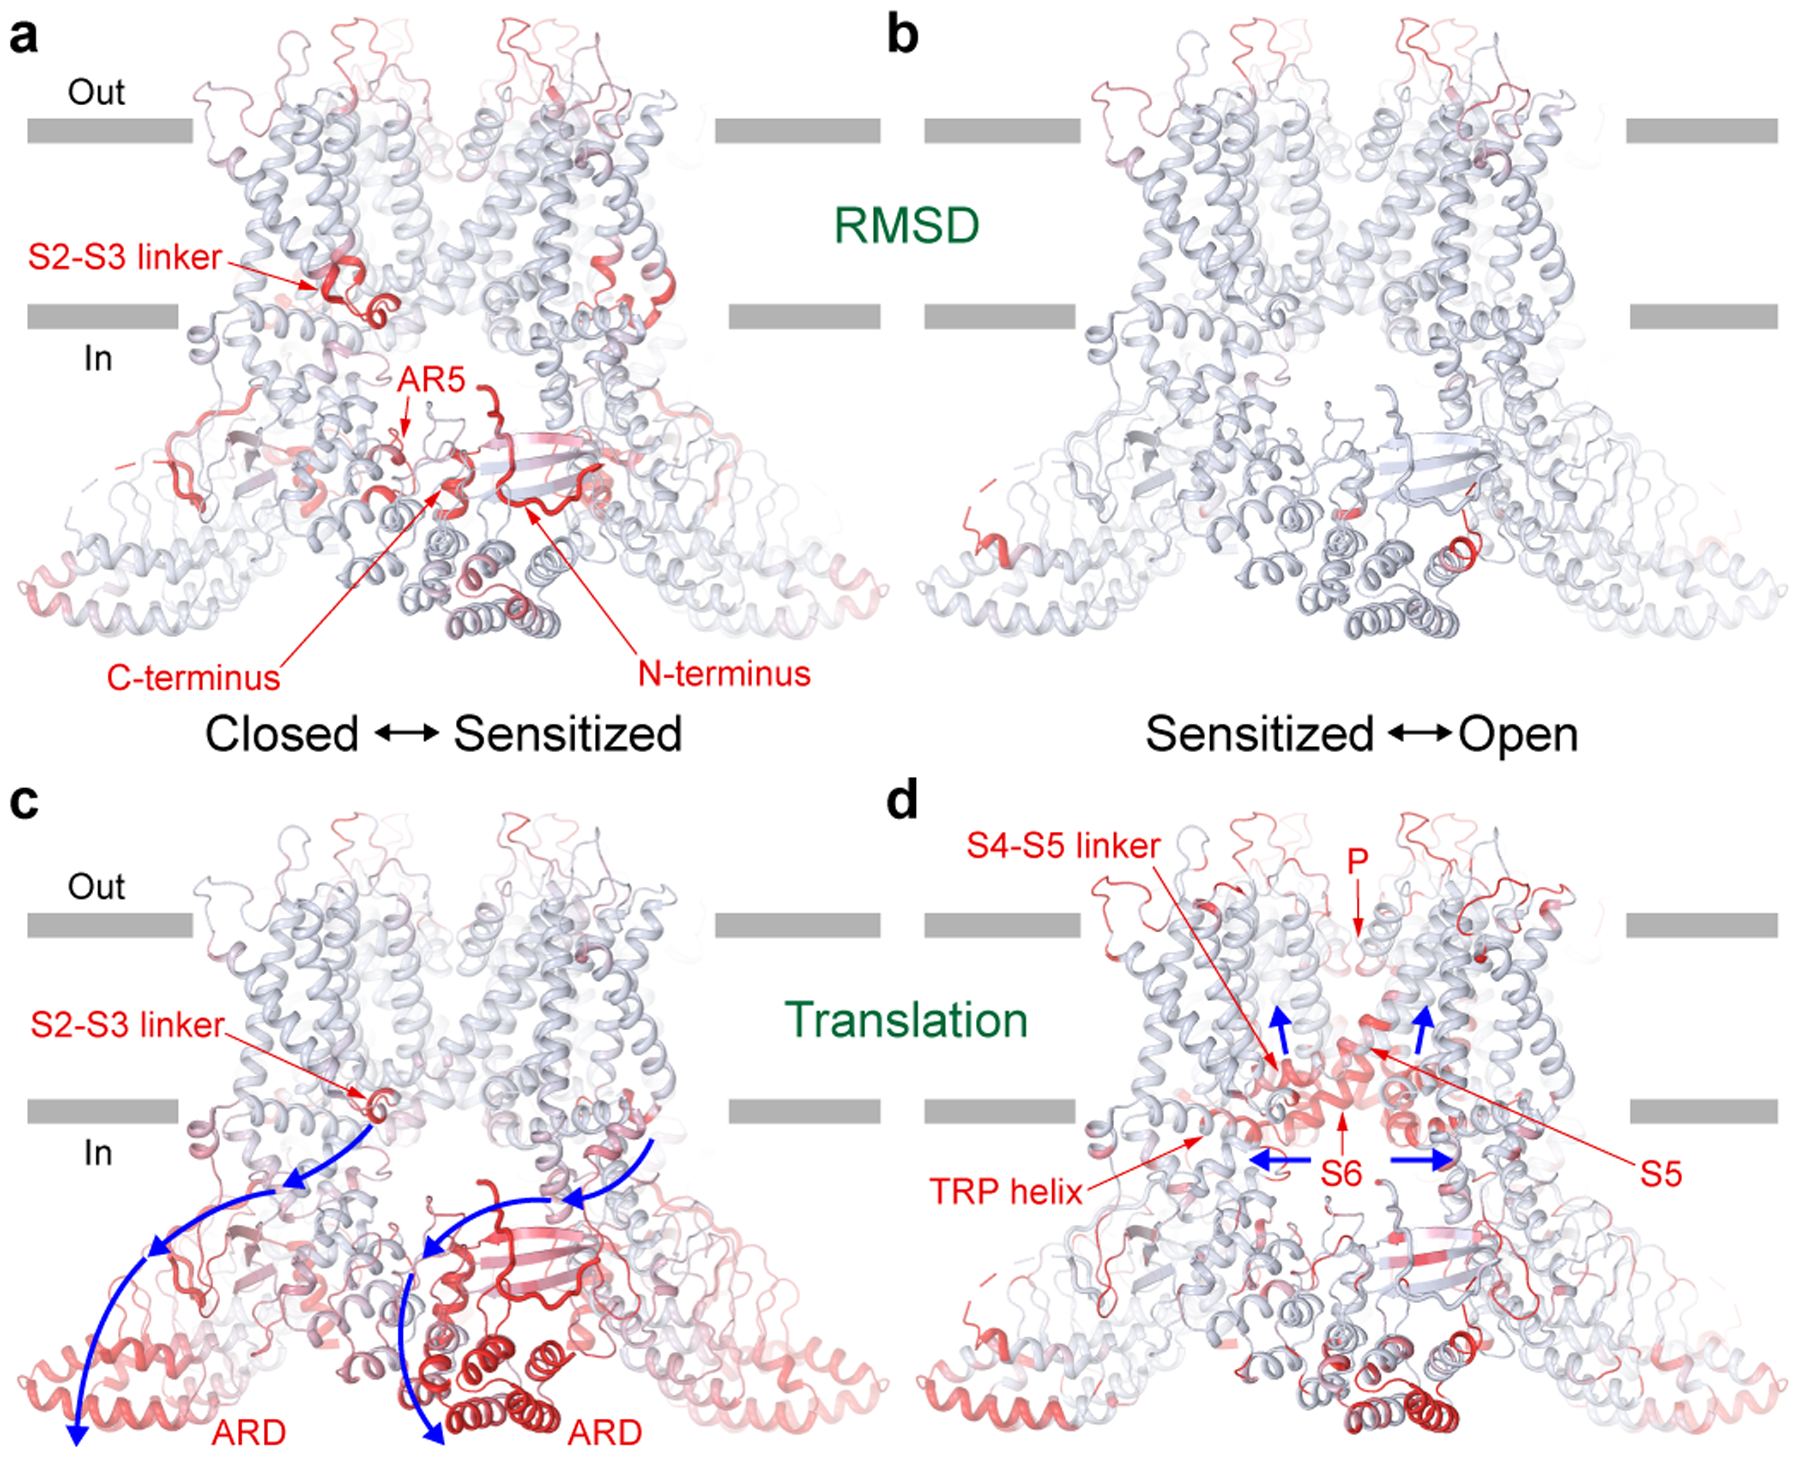
Light blue (no changes) to red (strong changes) gradient of RMSD (a-b) or translation (c-d) calculated between closed and sensitized (a, c) or sensitized and open (b, d) states and mapped on the sensitized state structure. RMSD values were calculated for Cα atoms along the entire TRPV3 sequence with a sliding window of 10 residues. Cα atom translations were calculated after aligning S1-S4 domains of the corresponding structures. Regions of the greatest structural changes are labelled. Blue arrows indicate the direction of the conformational wave accompanying closed to sensitized (c) and sensitized to open (d) state transitions.