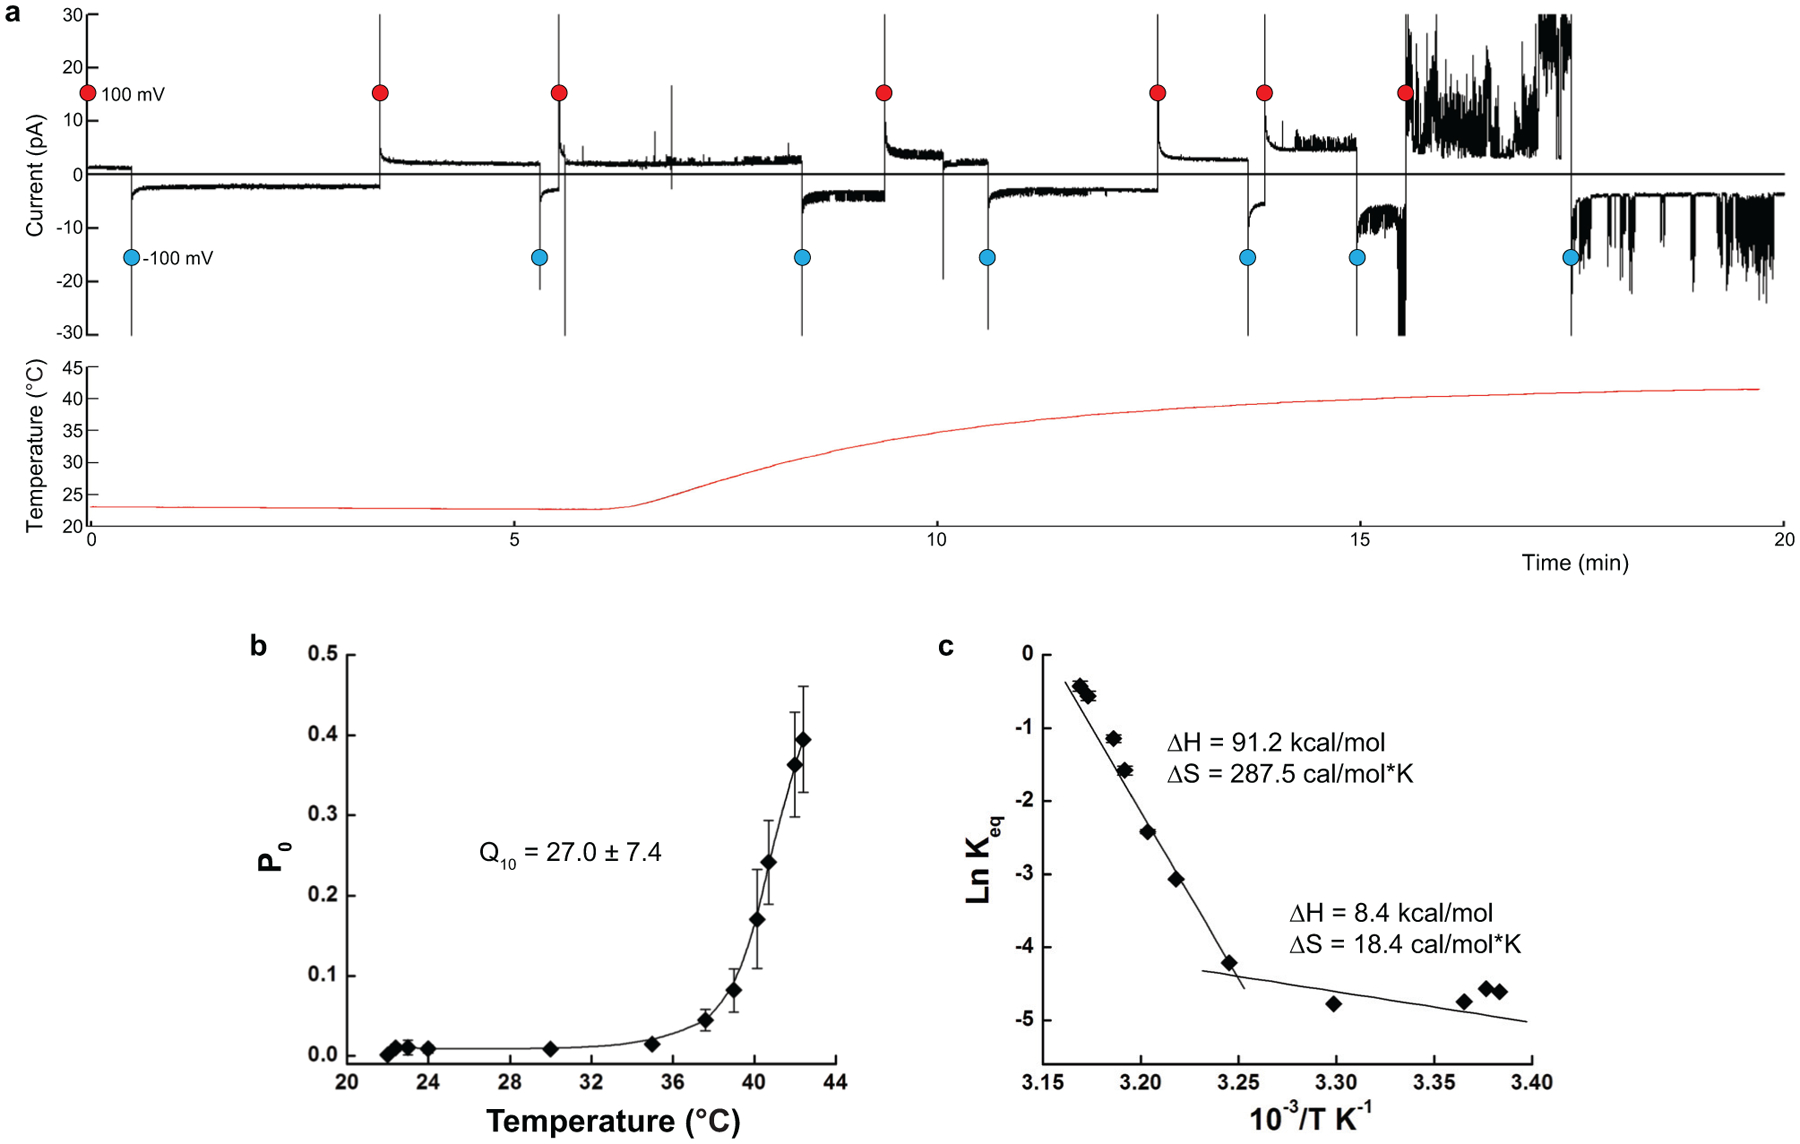
Extended Data Fig. 1. Temperature-dependent changes in currents and thermodynamics of TRPV3.

a, A representative continuous recording of current from multiple TRPV3 channels occasionally reconstituted into the synthetic lipid bilayer - (black) in response to the temperature ramp from 22 to 42°C (red), with the membrane potential alternating between +100 mV (red circles) and −100 mV (blue circles). Note the sharp increase in current activity in the 36–42°C temperature range. b, Temperature dependence of the open probability Po at +100 mV calculated using single-channel recordings (see examples in Fig. 1b; n = 19 independent experiments; 189,976 events were analyzed; the data includes the previously published12 and new recordings). Fitting of the data allows estimation of the temperature coefficient, Q10 = 27.0 ± 7.4 (n = 19 independent experiments). c, Van’t Hoff plot of the equilibrium constant Keq calculated using the values of Po (see Methods). Linear fits in the 22–36°C and 36–42°C temperature ranges provide the values of changes in enthalpy and entropy for the temperature-induced activation of TRPV3. Data in b and c are presented as mean values ± SEM. Source data for b and c are available online.
