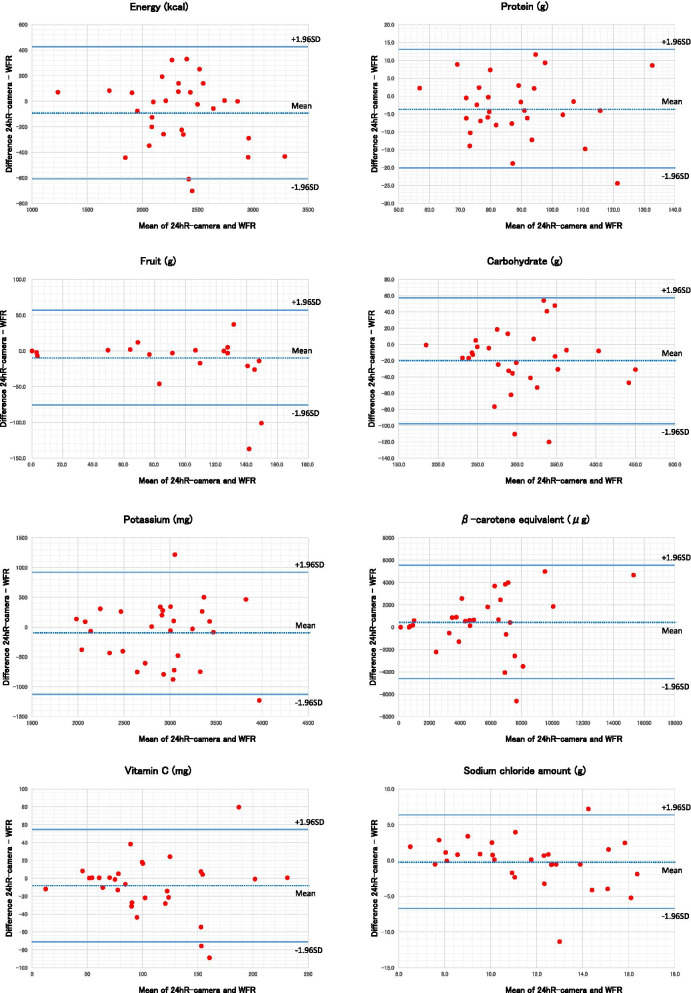
Fig. 4.
Comparison of intakes of energy and nutrients between 24hR-camera and WFR using Bland–Altman plots. The differences between the amounts of energy and nutrients estimated by 24hR-camera and WFR (Y-axis) were plotted against their mean values (X-axis). The dotted line shows the average difference between the two methods; the smaller the difference, the smaller the systematic bias. The solid lines show the 95% limits of agreement representing the range in which most differences are expected to fall; the smaller the range, the smaller the difference between two methods for most individuals

