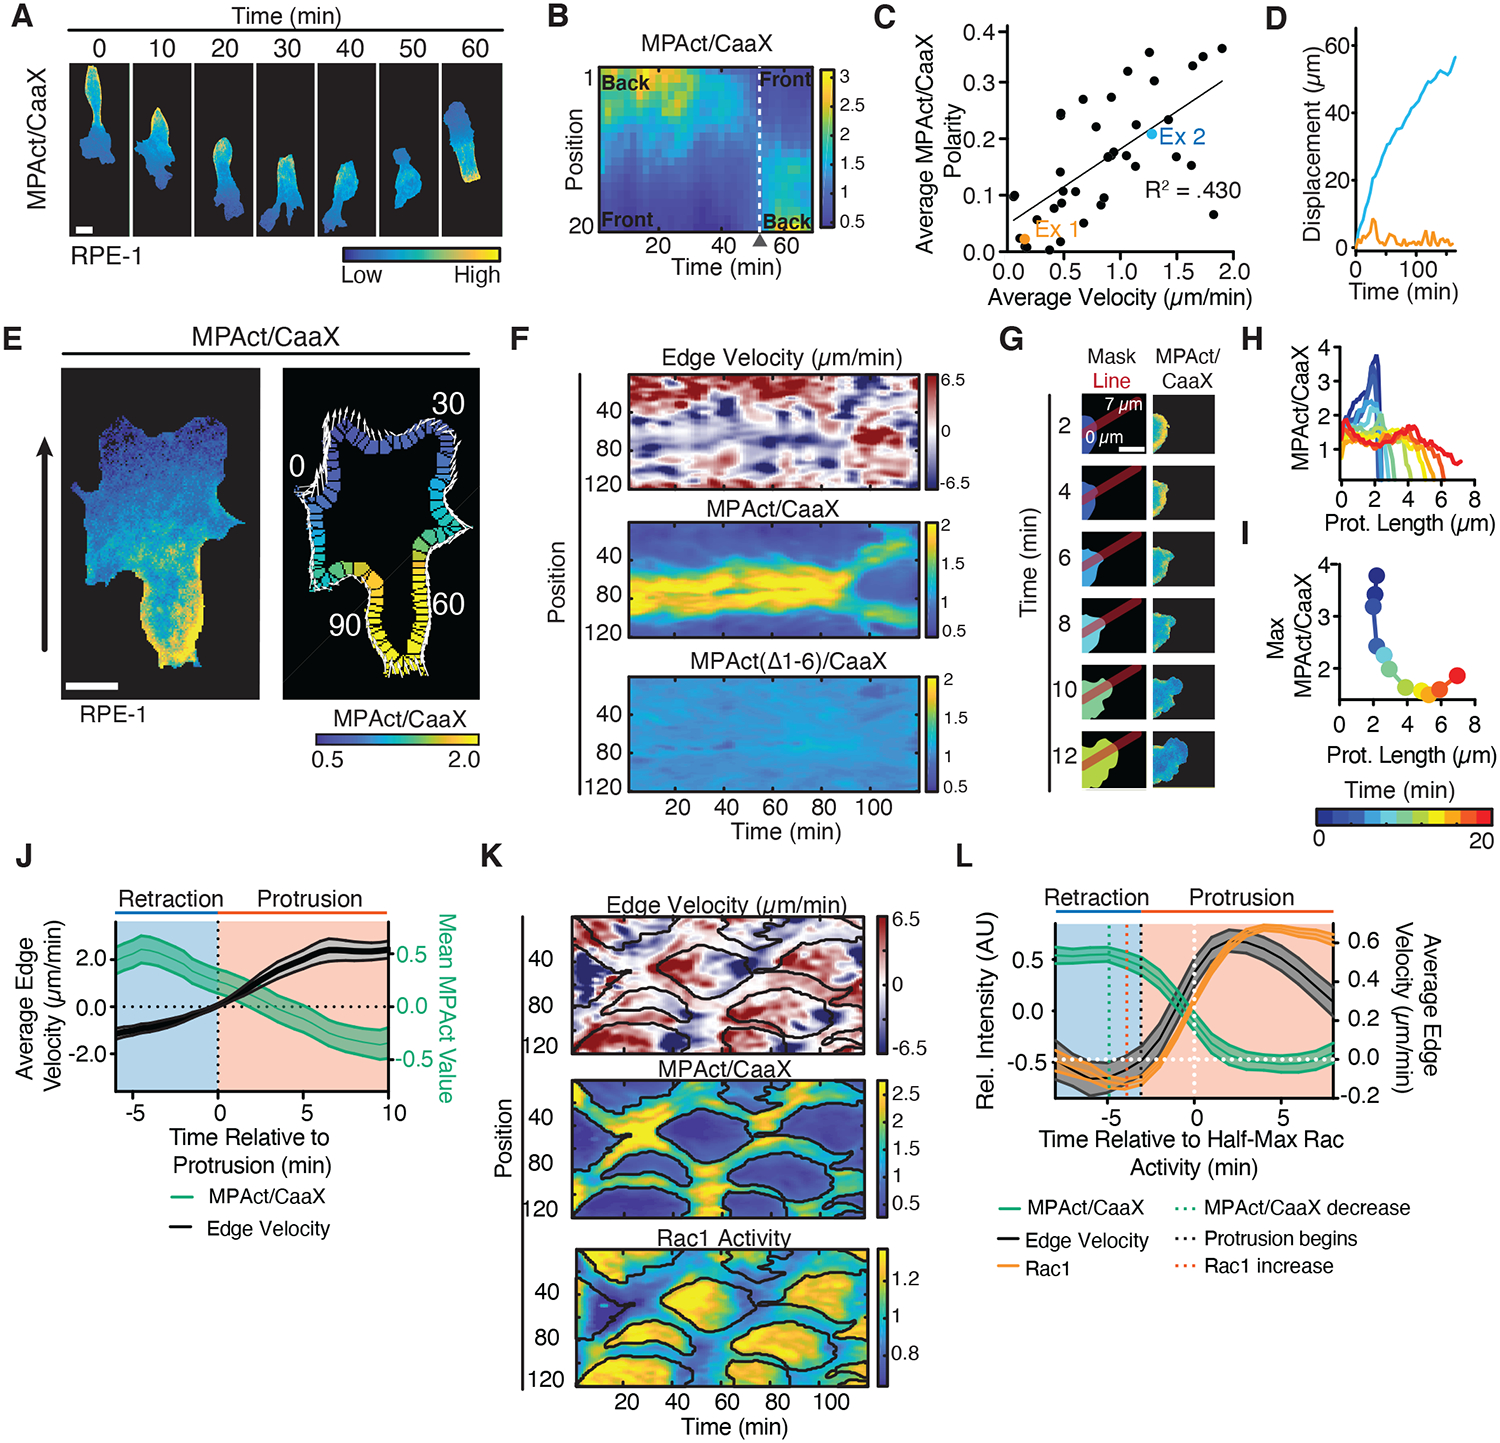
Fig. 3. MPA density is locally lowered prior to local Rac activation and local membrane protrusion.

(A, B) Repolarization of migrating RPE-1, MPAct/CaaX image series (A). Kymograph analysis (B). (C-D) Mean MPAct/CaaX gradient steepness versus mean velocity for HT-HUVEC migrating on stripes over periods > 1 hour. Gradient steepness calculated as ratio of MPAct signal between back and front 10 % of cell. Average velocity is total displacement/time. Line of best fit shown. N = 43 cells from 2 independent experiments. (D) Centroid displacement for the two cells marked in (C). (E) Edge parametrization. Local protrusion direction and distance shown as white arrows, global direction as black arrow. (F) Comparison of local edge velocity (top), MPAct/CaaX (middle), MPAct(Δ1–6)/CaaX (bottom) signals versus time. Images taken every 1 minute. (G-I) MPAct signal change during local retraction and protrusion. Red line shows profile direction (G). Analysis of MPAct/CaaX line profile over time (H) and maximal MPAct signal as a function of time and protrusion length (I). Scale bar = 5 μm. (J) Comparison of mean protrusion edge velocity and local MPAct signal change. Traces aligned to time of protrusion. Mean and 95% CI, N = 25 repolarization events. (K) Kymograph of normalized edge velocity (top), MPAct/membrane (middle), and Raichu-Rac1 FRET (bottom) in RPE-1. Edge analysis as in (E-F). Black outlines marks areas of low MPAct signals. (L) In silico activity alignment to half-maximal Rac activation, comparing edge velocity (black, right y-axis), MPAct (green left y-axis), and Raichu-Rac1 (orange, left y-axis) signal time courses. Mean and 95% CI, N =30 events, 3 independent experiments.
