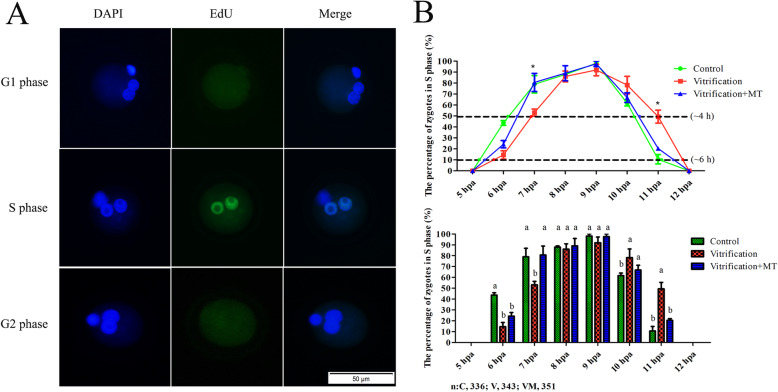
Fig. 4.
S phase transition of PA zygotes. a depicts zygotes with green fluorescence in pronuclear in the S phase. DAPI marks DNA. Scale bar = 50 μm. b represents a histogram depicting the proportion of S phase zygotes of each group at each time point. c is a broken line graph representing the proportion of S phase zygotes at each time point, which is used to reflect the length of S phase and time variation trend of each group in the S phase. The data are expressed as mean ± standard error of four independent trials. Values with different superscripts (a, b) are significantly different (P < 0.05)。“n” represents the cell number used in this experiment

