Fig. 7.
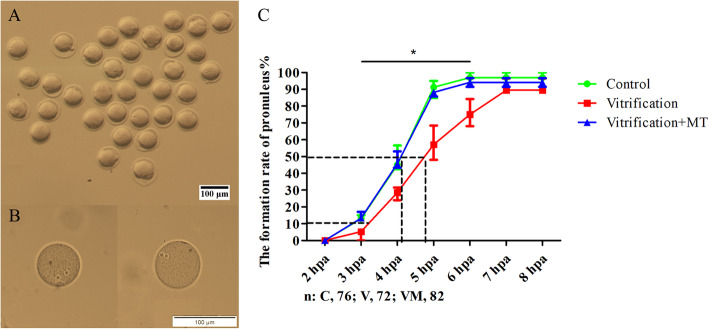
Pronuclear formation in PA zygotes. a was obtained by using stereomicroscope and original magnification of 100× was used for counting of pronuclear formation. b was obtained by using epifluorescence microscope and depicts the high resolution image of pronucleus. In c, the line chart depicts the rate of pronuclear formation from 2 to 8 hpa. “*” and black line represent that the control and vitrification +MT groups are significantly different compared to vitrification group at each time point under the black line (P < 0.05). Dotted line represents the time when 50% of oocytes formed pronuclear. The data are expressed as mean ± standard error of three independent trials. Scale bar = 100 μm. “n” represents the cell number used in this experiment

