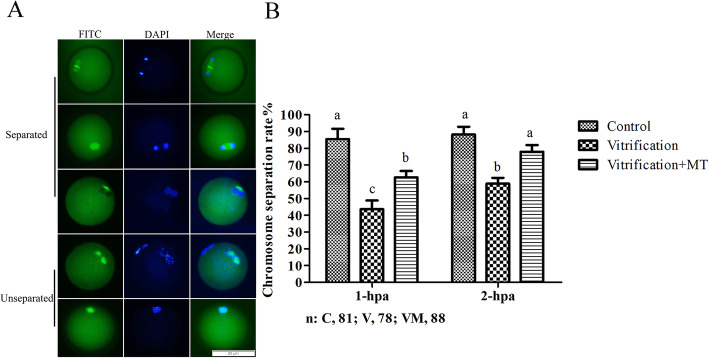
Fig. 9.
Chromosome segregation after PA of MII oocytes. a, with two apparent chromosome sets in oocyte cytoplasm represents that chromosomes are separated. If not, like the last two figures and images as shown in a represents that chromosomes remain unseparated. The scale bar = 50 μm. In b, histogram shows the rate of chromosome segregation at 1 and 2 hpa. The data are expressed as mean value ± standard error of four independent trails. Values with different superscripts ((a, b) are significantly different (P < 0.05). “n” represents the cell number used in this experiment

