
Figure 3.
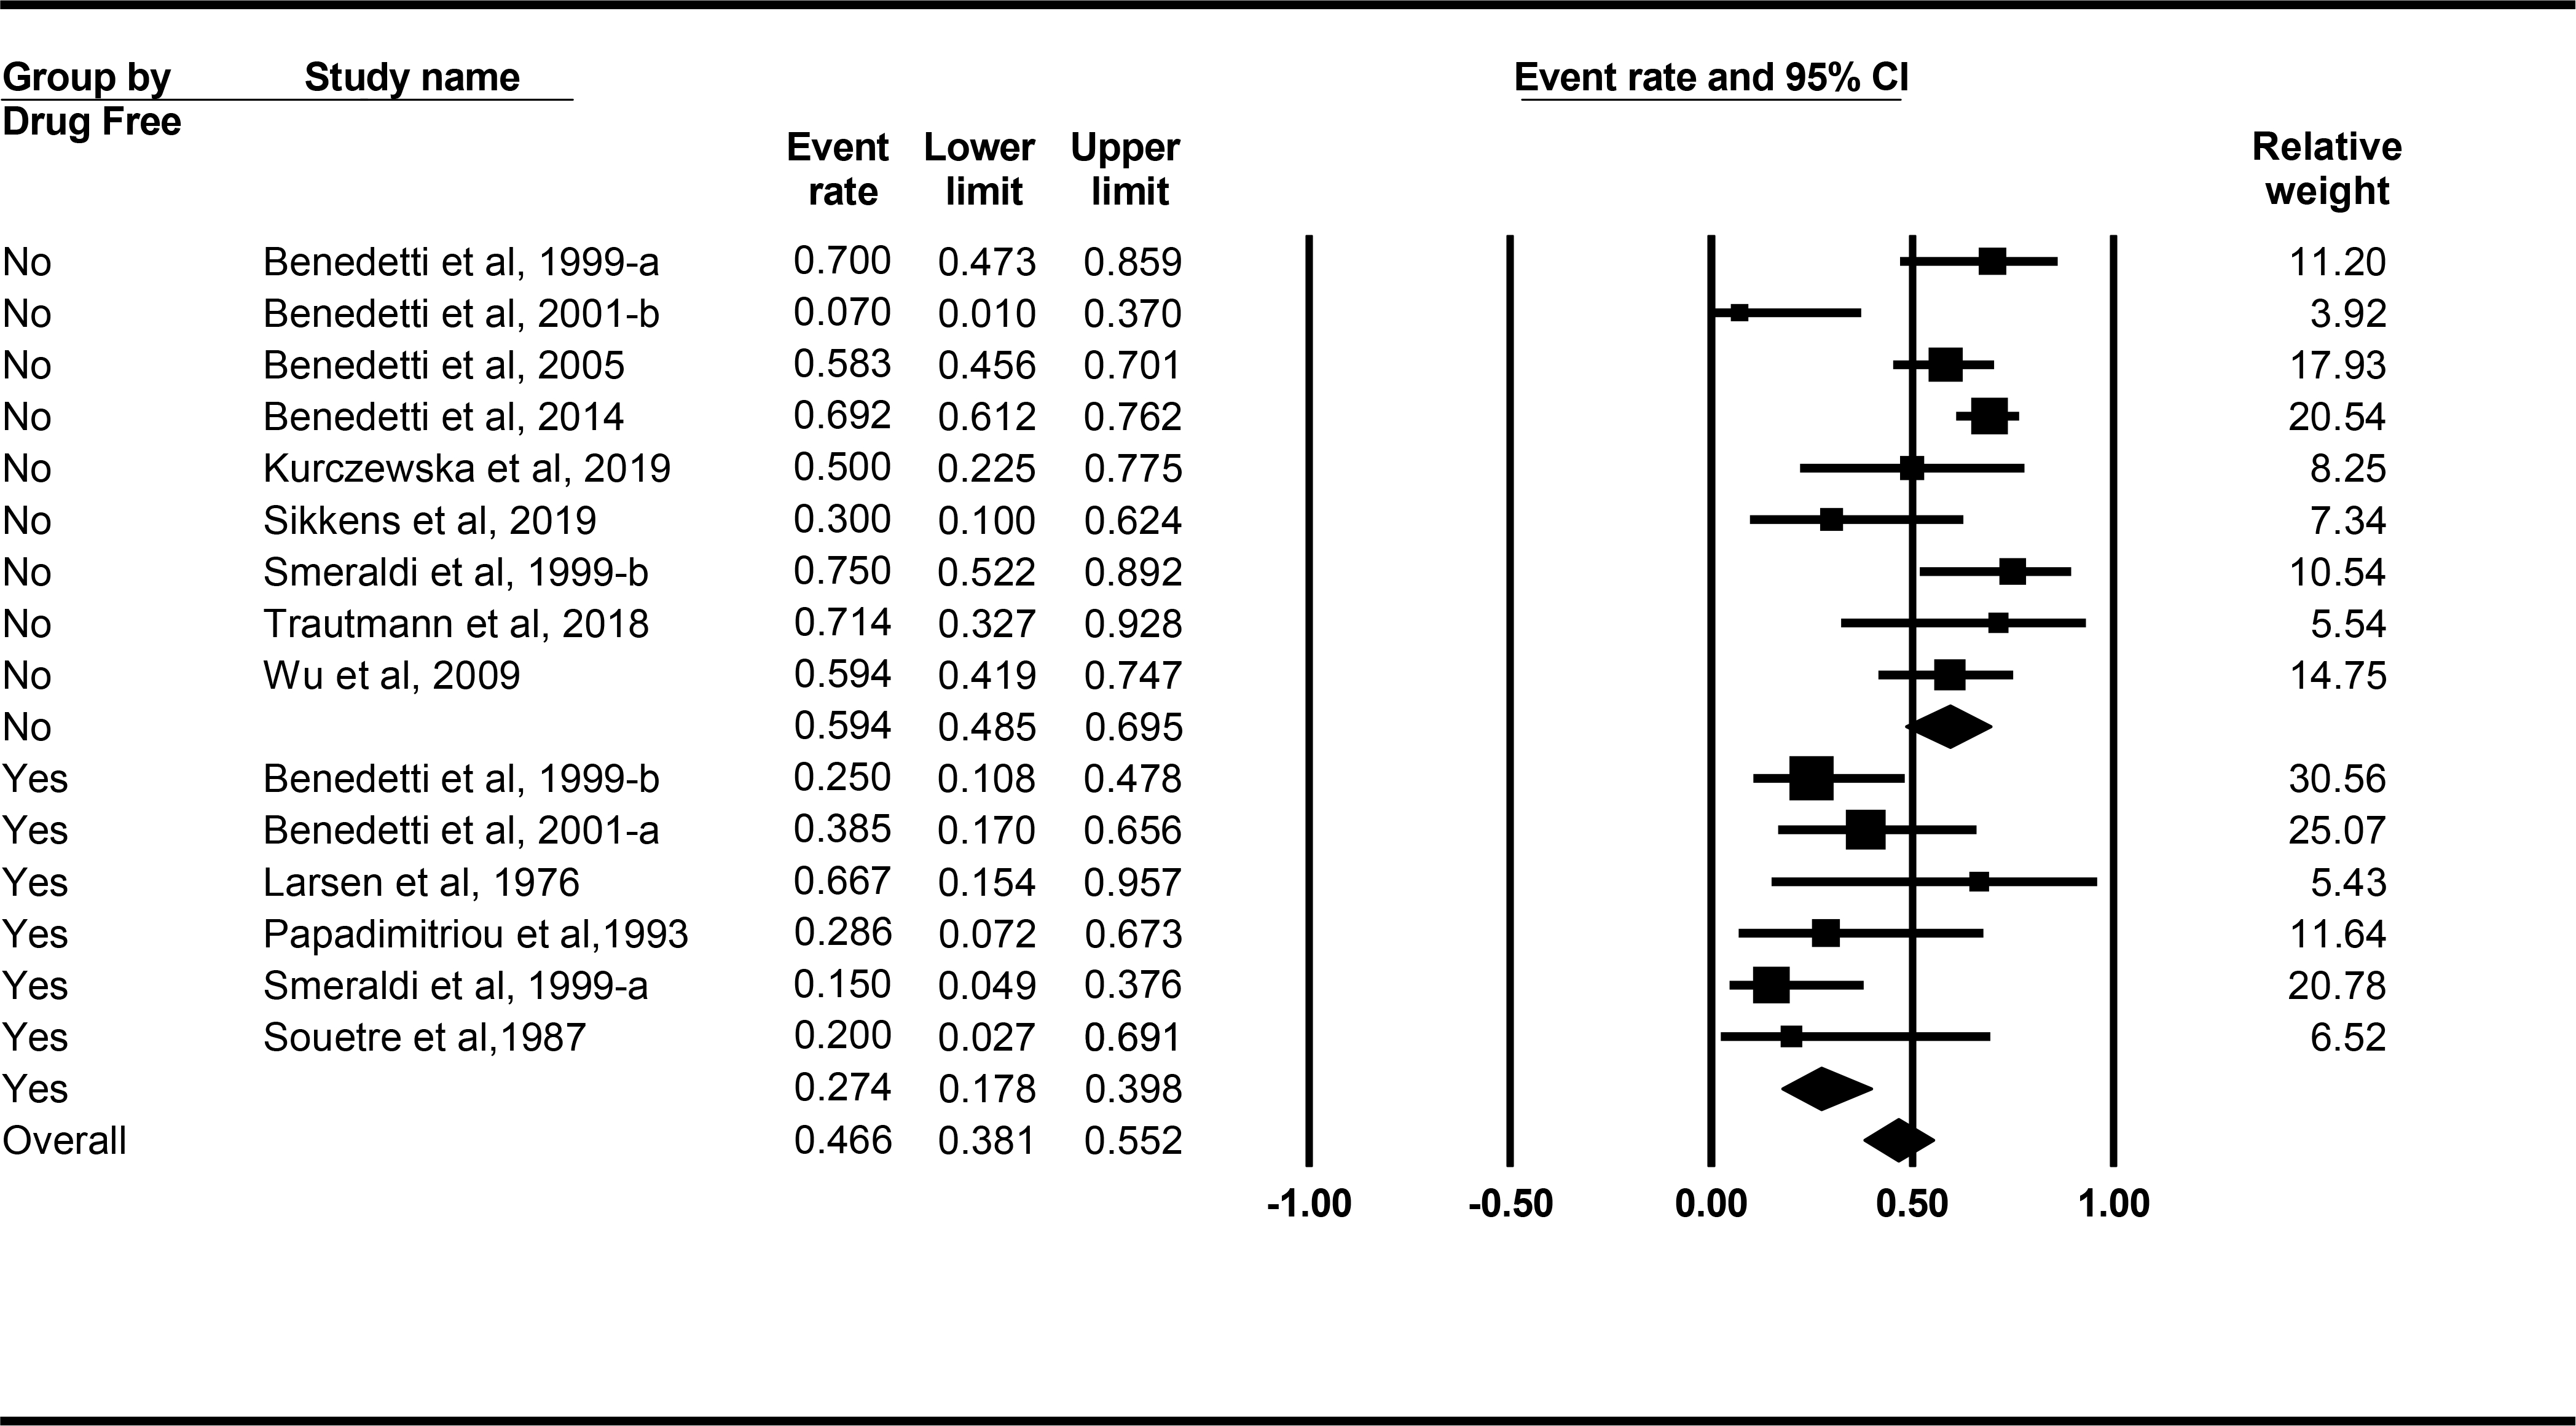
Forest plots from meta-analysis for response rate, 95% CI and weight for each study using medication treatment as a moderator of response rate. Lines represent 95% CI.
Official websites use .gov
A
.gov website belongs to an official
government organization in the United States.
Secure .gov websites use HTTPS
A lock (
) or https:// means you've safely
connected to the .gov website. Share sensitive
information only on official, secure websites.
Forest plots from meta-analysis for response rate, 95% CI and weight for each study using medication treatment as a moderator of response rate. Lines represent 95% CI.