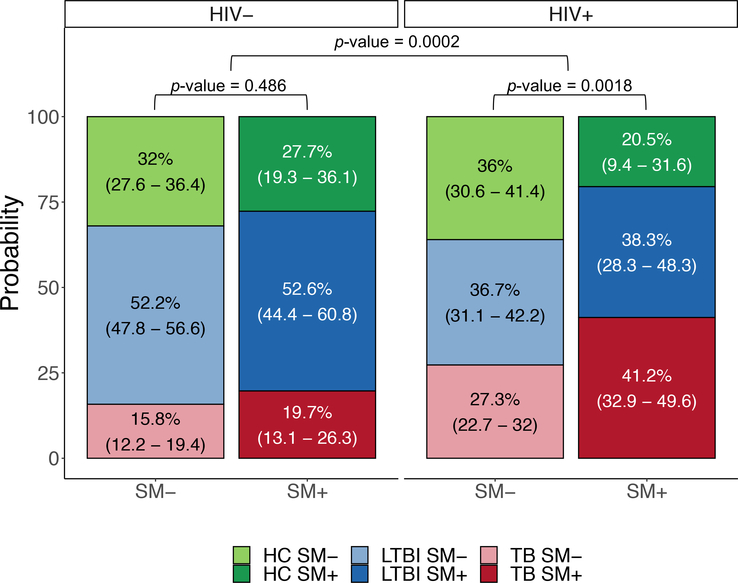
Figure 2: Estimated Distribution of Mtb Infection Outcomes.
Probabilities are derived from TMLE estimation and are represented as stacked bar plots ± 95% confidence interval. Standard error estimates were obtained using estimated influence functions and the delta method. Significance level was calculated using Wald tests. The estimated distribution of Mtb infection outcomes differs between SM− and SM+ HIV+ individuals. The difference in the estimated proportion of Mtb infection outcomes beween SM+ and SM− groups differs between HIV+ and HIV− individuals.

