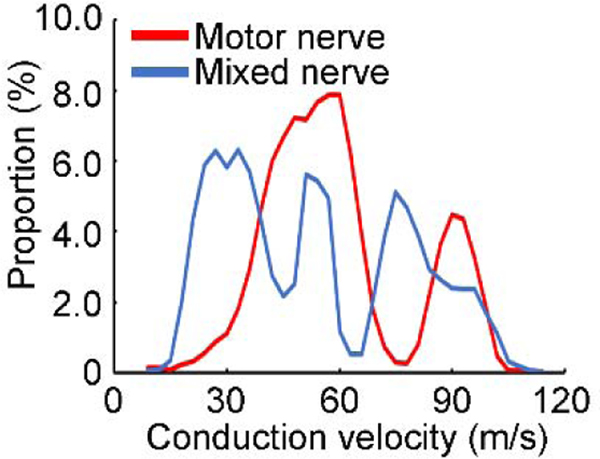
Figure 4. Conduction velocity distributions for motor and mixed nerve fibers.
Data obtained from one subject. Abscissa indicates the conduction velocity of the nerve fiber. Ordinate indicates the proportion (percentage value) of the nerve fibers with certain conduction velocity in the whole bundle. Values on motor and mixed nerve were calculated separately. Red line indicates the distribution of the motor nerve and blue line indicates the distribution of the mixed nerve.

