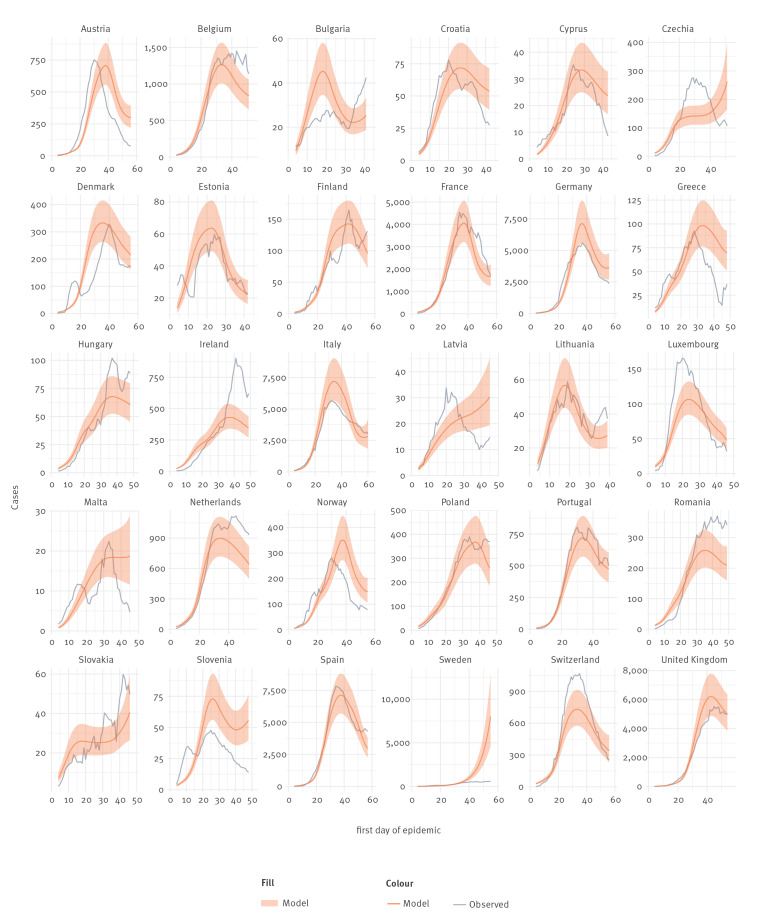
Figure 4.
Comparison of predicted daily reports of COVID-19 case numbers with 7-day rolling average actual numbers, 30 European countries, 2020
COVID-19: coronavirus disease.
The central line is the posterior mean of the predictions made by the models (for individual countries over time); shading is the 95% credible interval.

