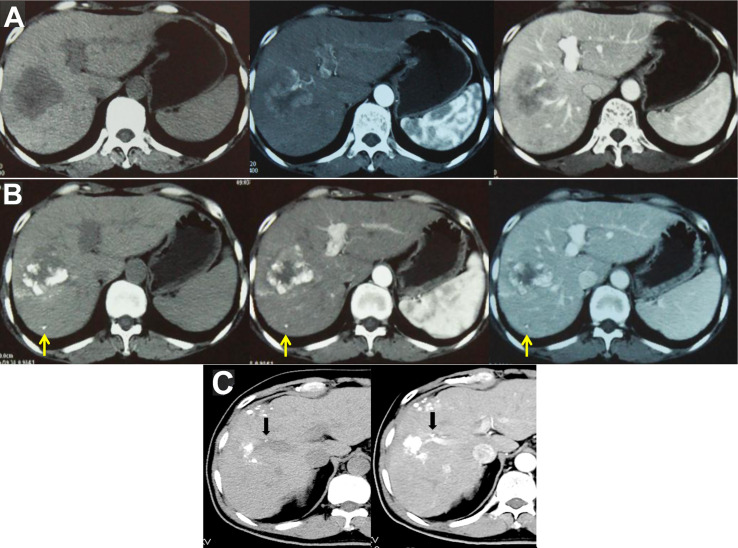
Figure 4.
TACE-CT enables detection of focal loci and precise staging. (A) CT before treatment showed a 7-cm tumor in the S5 and S6 region of the liver; (B) Follow-up CT examination at 4 weeks after TACE showed that the tumor volume at S5 and S6 was reduced, while a small lesion was detected at S6, as indicated by the arrow; (C) In another male patient, follow-up CT examination at 3 weeks after TACE showed intravascular lipiodol deposits (indicated by the arrow), suggesting the formation of an intravascular small tumor thrombus.

