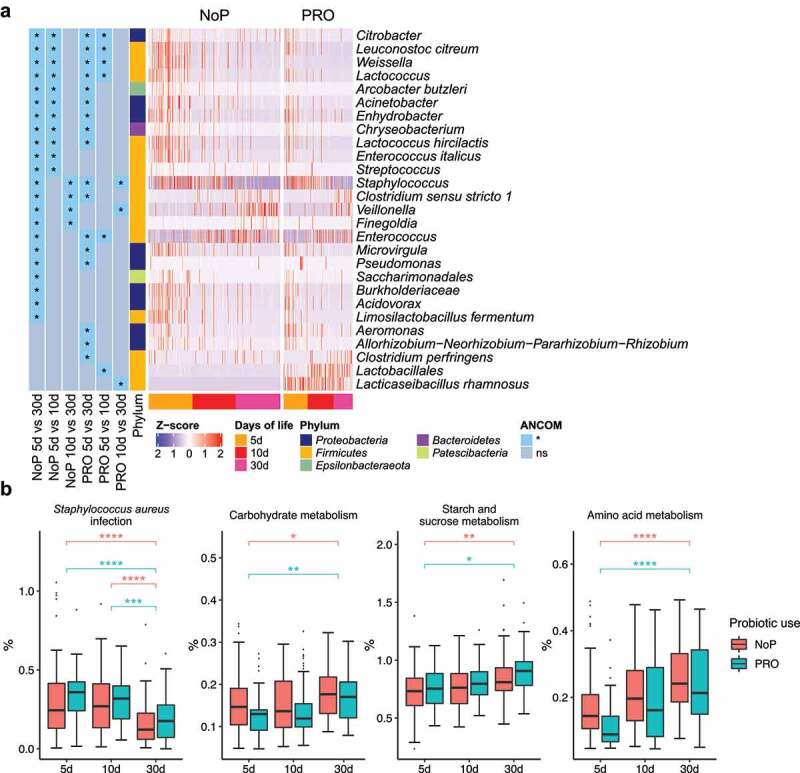
Figure 4.

The longitudinal structural and functional progression of preterm gut microbiota. Differentially abundant taxa (a) and microbial functional capacities (b) between different DOL periods. Differentially abundant taxa were determined by ANCOM and labeled with * in the heatmap, indicating the significantly altered taxa from the respective between-group comparison. Row-wise Z-score scaling was conducted in the heatmap visualization, showing the normalized relative abundance by the mean of the specific taxa across all samples. In the boxplots, *, **, *** and **** represent adjusted p < .05, 0.01, 0.005, 0.001 between different DOL periods, and its color indicates respective comparisons within PRO and NoP. PRO, probiotics cohort; NoP, non-probiotics cohort
