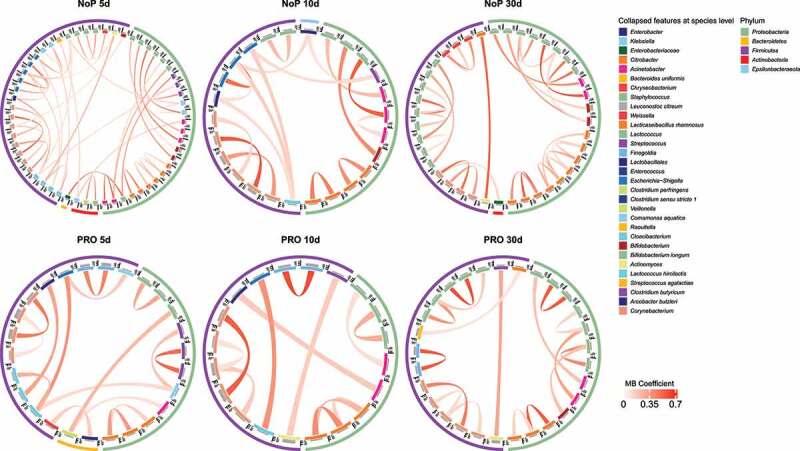
Figure 6.

Gut microbiota co-occurrence network of PRO and NoP neonates in the first postnatal month. Core ASVs are used to calculate each sub-network under a threshold of relative abundance > 0.1% and percentage of presence > 30%. Taxon-taxon interactions were assessed by the Meinshausen and Bühlmann (MB) neighborhood method and the MB coefficients between taxa determine the color depth of inner chord graphs. The phylum-level information and the lowest taxonomic annotations are differentiated by color in the first and third circles respectively, and the mean relative abundance of taxa is shown by bar-plot in the second circle. PRO, probiotics cohort; NoP, non-probiotics cohort
