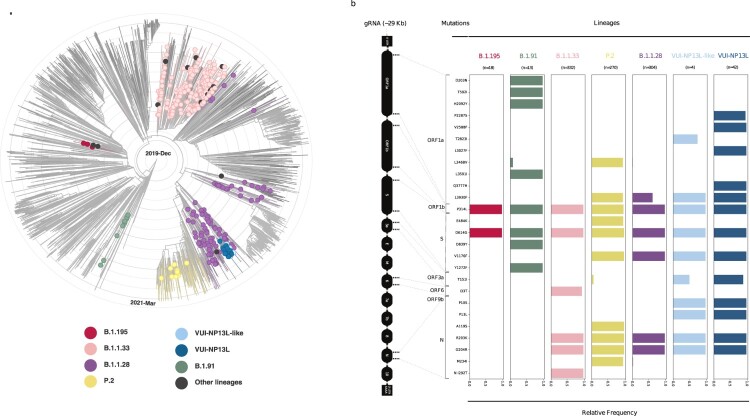
Figure 1.
Phylogenomic reconstruction of the SARS-CoV-2 genome. (a) Phylogenetic tree of 340 sequences described in this study combined with a dataset of 3,625 South American genomes. Branch lengths are proportional to the collection date (between Abril 2020 and March 2021). Concentric circular rings represent the timeline (interval every three months). Each filled circle represents our SARS-CoV-2 sequences, and they are coloured according to lineage (legend box). (b) Highlighter plot showing SARS-CoV-2 mutation patterns along the genome evaluated here. Mutations are colour-coded according to the lineages shown in Figure 1A legend.

