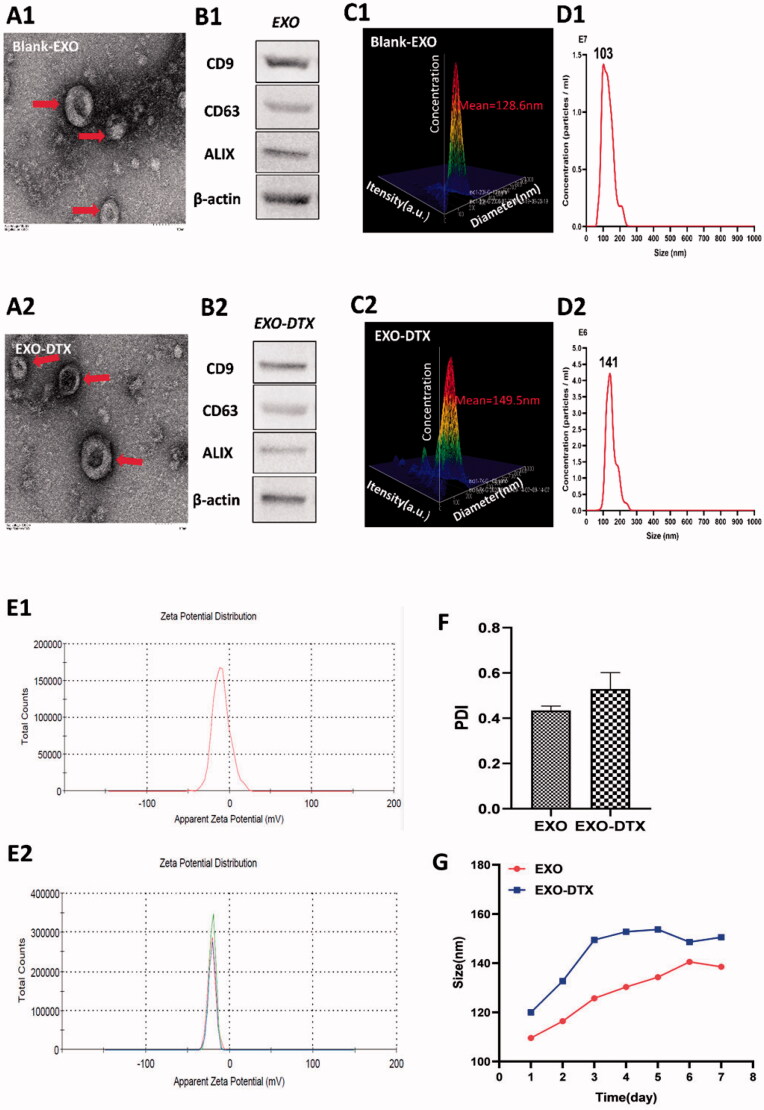
Figure 2.
Characterization of the EXO and EXO-DTX. (A1, A2) Scale bar represented 100 nm. Morphology of EXO and EXO-DTX under transmission electron microscopy. (B1, B2) Western blot (WB) analysis of EXO and EXO-DTX. (C1, C2) The average size of the EXO and EXO-DTX group. (D2, D2) The micelle size distribution in the EXO and EXO-DTX group. (E1, E2) The zeta potential of EXO and EXO-DTX at 4 °C. (F) The PDI of EXO and EXO-DTX at the 4 °C. (G) The size variation of EXO and EXO-DTX at the 4 °C over time.

