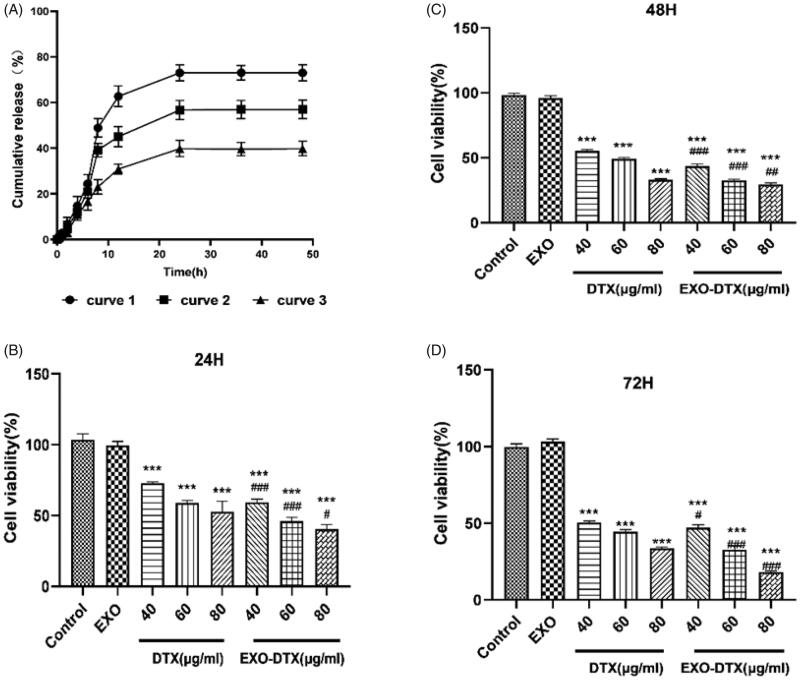
Figure 3.
(A) In vitro release profiles of DTX and EXO-DTX. Curve 1: DTX release in 1% SDS PBS (pH = 7.4, 37 ± 1 °C); curve 2: EXO-DTX release in 1% SDS PBS (pH = 5.8, 42 ± 1 °C); curve 3: EXO-DTX release in 1% SDS PBS (pH = 7.4, 37 ± 1 °C. (B–D) Cytotoxic effects of DTX and EXO-DTX in vitro. After the incubation of the 96-well plate, A549 cells were treated with DTX and EXO-DTX at different doses for 24/48/72 h, respectively. CCK-8 assay was conducted to measure cell viability. Values were expressed as mean ± SD. ***p< 0.001 compared to the control, #p< 0.05, ###p< 0.001 compared to the DTX group at an identical dose.

