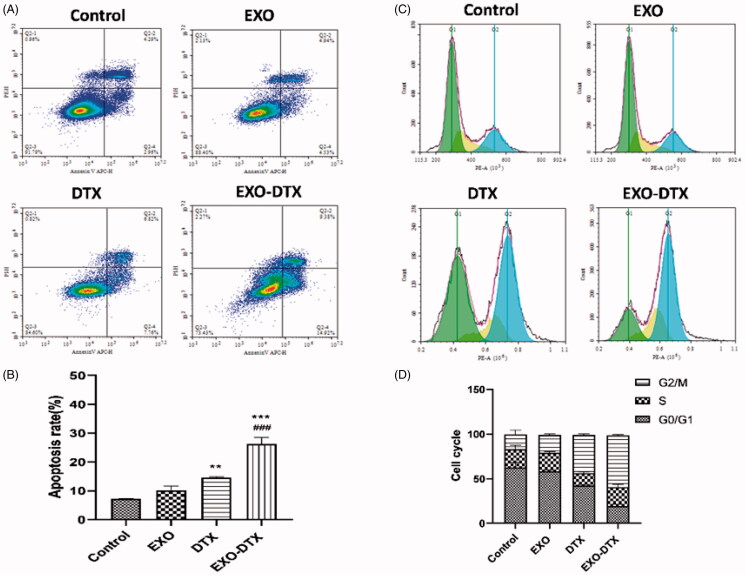
Figure 4.
Cell apoptosis analysis in vitro (A, B) Analysis of the cell cycle (C, D). After 24 h of DTX, EXO, and EXO-DTX treatment, A549 cells were collected for the Annexin V-FITC/PI staining and FACS, where the A549 cells were collected, fixed by 70% ethanol, and then stained with PI. Finally, each sample was subjected to FACS. Values were expressed as mean ± SD. **p< 0.01, ***p<0 .001 compared to the control, and ###p< 0.001 compared to the DTX group.

