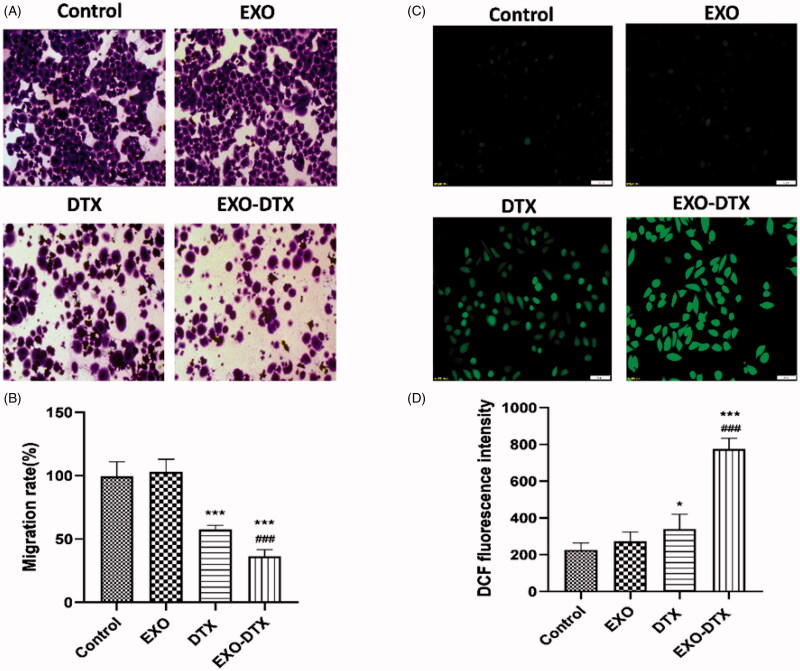
Figure 5.
In vitro cell migration studies (A, B). ROS production in A549 cells incubated with EXO, DTX, and EXO-DTX (C, D). A549 cells treated with EXO, DTX, and EXO-DTX were stained with DCFH-DA and observed under fluorescent microscope (×20). Scale bar represented 50 μm. ***p< 0.001; *p<0 .05 vs. control; ###p<0 .001 vs. the DTX group.

