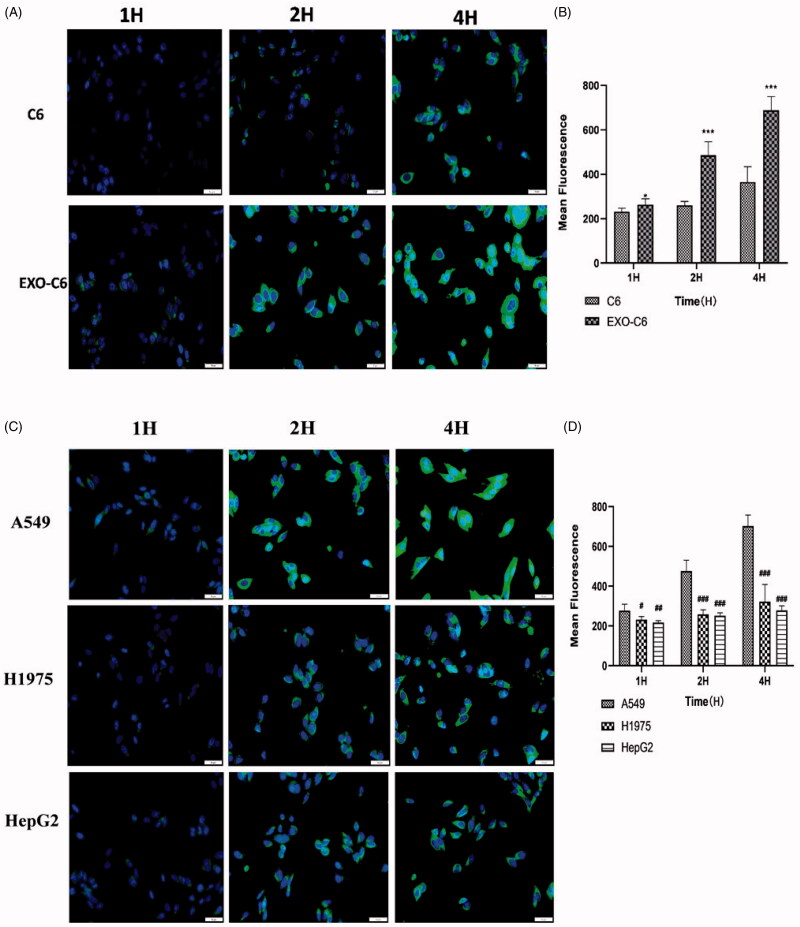
Figure 6.
(A) Fluorescence microscopy images of C6 and EXO-C6 after incubating A549 cells for 1, 2, and 4 h. (B) A statistical analysis diagram showing the fluorescence intensities of C6 and EXO-C6. (C) Fluorescence microscopy images of EXO-C6 after incubating A549, H1975, and HepG2 cells for 1, 2, and 4 h. (D) A statistical analysis diagram showing the fluorescence intensities of EXO-C6. Values were displayed as mean ± SD (n = 3). Scale bar represented 50 μm. ***p<0 .001 vs. the C6 group. #p<0 .05 vs. the A549 group, ##p<0 .01 vs. the A549 group, and ###p< 0.001 vs. the A549 group.

