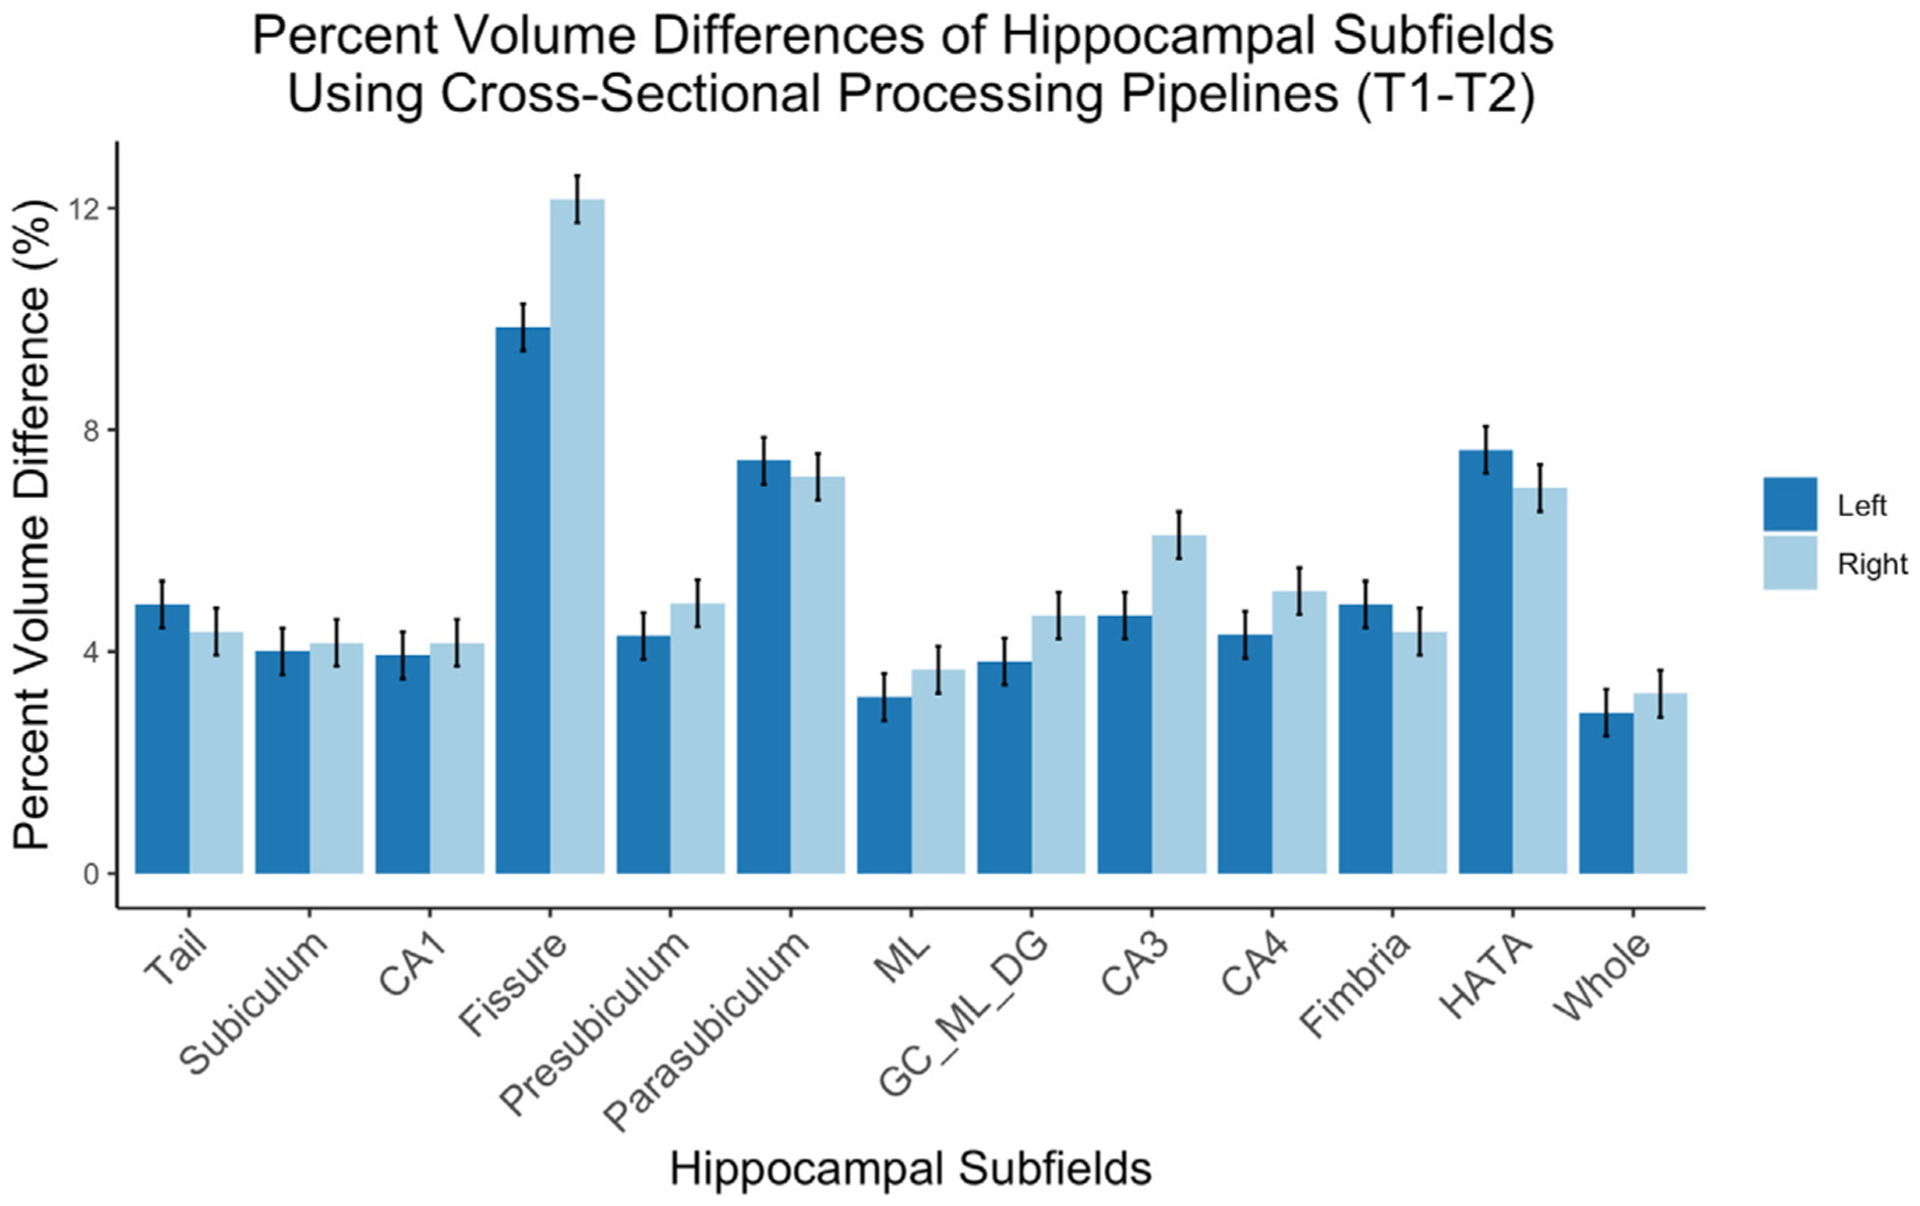
Fig. 2.

Percent Volume Differences for all hippocampal subfields across two consecutive scan days (T1 – T2). Error bars represent standard error. Left, left hemisphere; Right, right hemisphere; CA, cornu ammonis; ML, molecular layer; GC_ML_DG, granule cell layer of the dentate gyrus; HATA, hippocampal-amygdaloid transition area; Whole, whole hippocampal volume. N = 175. ICC (T1 – T2).
