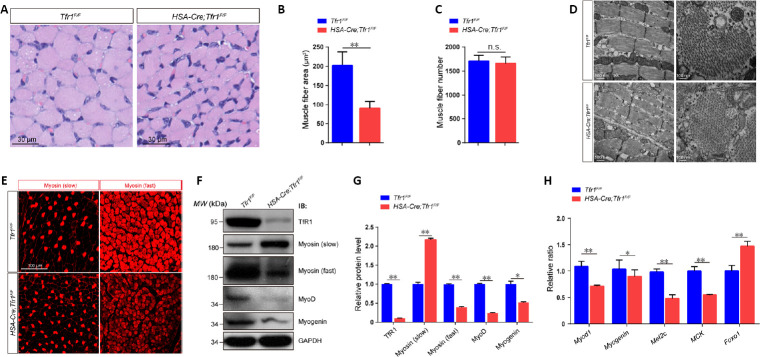
Figure 3.
Severe muscular atrophy in HSA-Cre;Tfr1F/F mutant mice.
(A) Hematoxylin-eosin staining of the cross-sections of gastrocnemius muscle in HSA-Cre; Tfr1F/F mutants and control littermates at P10. The outline of a single muscle fiber is indicated by a dashed line, revealing smaller cross-sectional area of muscle fibers in mutants compared with controls. Scale bars: 30 μm. (B, C) Quantitative analysis of the average muscle fiber area shows a significant reduction in HSA-Cre;Tfr1F/F mutants compared with control littermates at P10, but the number of muscle fibers was nearly the same. (D) Ultrastructural analysis of gastrocnemius muscles by electron microscopy. No significant misalignment of Z-lines (arrows) or central nuclei was found in either HSA-Cre;Tfr1F/F mutants or control littermates. Scale bars: 500 nm (left), 100 nm (right). (E) Immunofluorescence staining of gastrocnemius muscle cross-sections labeled with anti-myosin (slow) (arrowheads) or anti-myosin (fast) (asterisks) antibody (red, Alexa Fluor 568) in HSA-Cre;Tfr1F/F mutants and control littermates. Increased expression of slow-type myosin, but reduced expression of fast-type myosin, was found in HSA-Cre;Tfr1F/F mutants compared with control littermates. Scale bar: 100 mm. (F) Representative western blot shows the expression of TfR1, myosin (slow), myosin (fast), MyoD and myogenin in skeletal muscles from HSA-Cre;Tfr1F/F mutants and control littermates at P10. (G) Quantitative analysis of western blots showing significantly decreased expression of TfR1, myosin (fast), MyoD and myogenin, but increased expression of myosin (slow), in HSA-Cre;Tfr1F/F mutants compared with control littermates. (H) Quantitative reverse transcription-polymerase chain reaction analysis indicating significantly downregulated expression of Myod1, Myogenin, Mef2c and MCK genes in HSA-Cre;Tfr1F/F mutant mice. In contrast, Foxo1 was significantly upregulated in HSA-Cre;Tfr1F/F mutants compared with control littermates. Data are expressed as the mean ± SEM (n = 6). *P < 0.05, **P < 0.01 (Student’s t-test). Foxo1: Forkhead box protein O1; GAPDH: glyceraldehyde 3-phosphate dehydrogenase; HSA: skeletal muscle actin; MCK: muscle creatine kinase; Mef2C: myocyte enhancer factor 2C; n.s.: not significant; P10: postnatal day 10; Tfr1: transferrin receptor 1.

