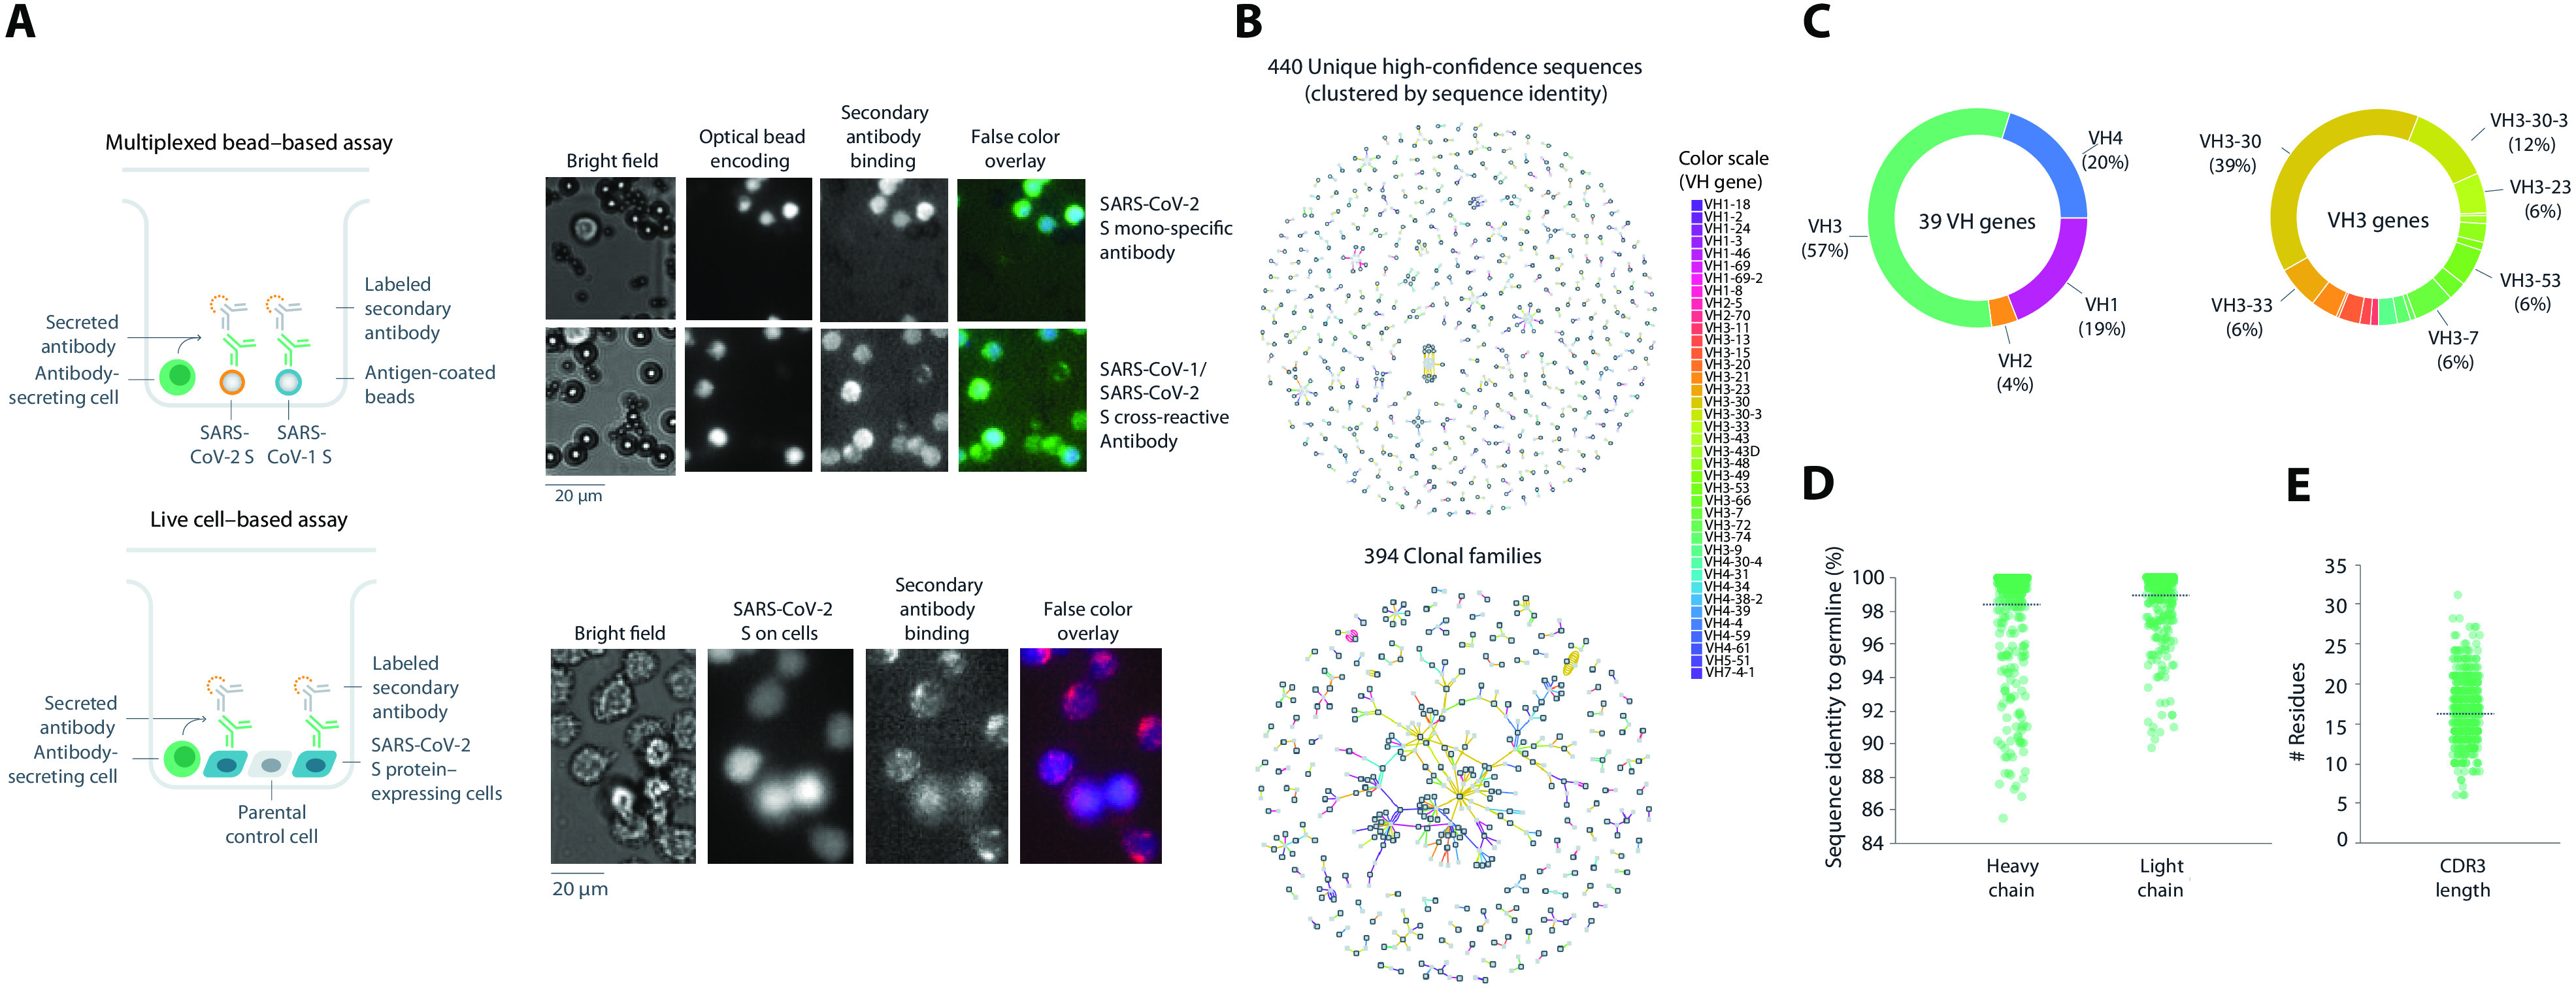
Fig. 1. Antibody screening and sequence analysis.

(A) Representation of multiplexed bead–based and live cell–based screening assays. Representative microscopic images of antibodies assessed for SARS-CoV-2 spike protein specificity in each indicated assay. (B) Sequence analysis of the 440 unique high-confidence paired-chain antibodies. Graphical representation of antibodies clustered according to sequence identity (top) or clonal family relationships (bottom). Each node indicates a chain or a cluster of chains. Heavy chains are outlined in black. Each line connecting the nodes indicates a single antibody, colored by VH gene usage according to legend. Multiple lines that connect to the same heavy- and light-chain clusters represent clonally related antibodies. (C to E) Sequence profiles of antibodies showing VH gene usage (C), distributions of sequence identity to germline for heavy and light chains (D), and CDR3 length (E). CDR3, complementary-determining region 3; VH, heavy chain variable.
