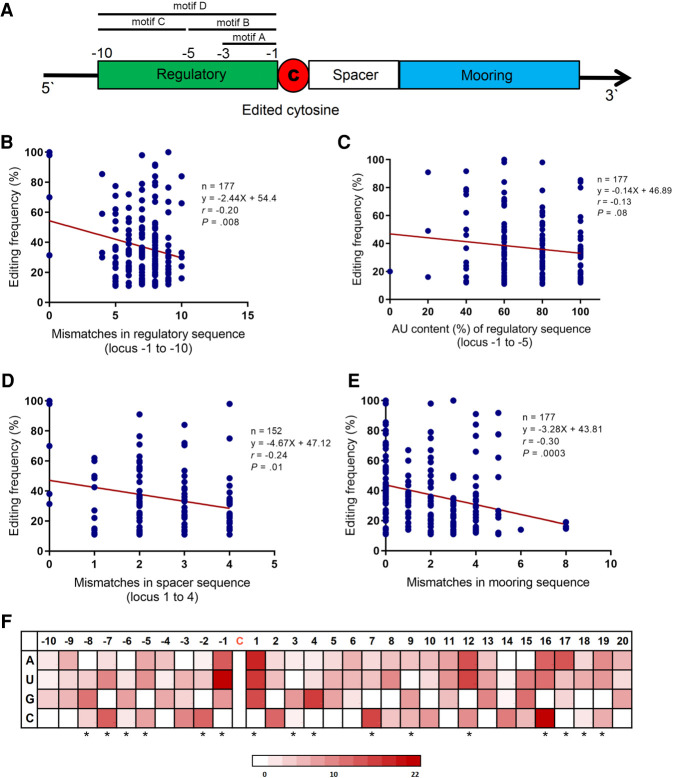
FIGURE 2.
Characteristics of regulatory-spacer-mooring cassette and base content of individual nucleotides flanking edited cytidine in association with editing frequency. (A) Schematic illustration of regulatory-spacer-mooring cassette. Four motifs were defined for regulatory sequence: motif A for nucleotides −1 to −3; motif B for nucleotides −1 to −5; motif C for nucleotides −6 to −10; motif D representative of the whole sequence. (B) Association of the mismatches in motif D of regulatory sequence with editing frequency. (C) Association between the AU content (%) of regulatory sequence (motif B) and editing frequency. (D) Association of the mismatches in spacer (nucleotides +1 to +4 downstream from the edited cytidine) with editing frequency. (E) Association of the mismatches in mooring sequence with editing frequency. (F) Heatmap plot illustrating the association between base content of 30 nt flanking the edited cytidine with editing frequency. Red color density in each cell represents the β coefficient value of corresponding base in the multivariable linear regression model fit including that nucleotide. The asterisks refer to the nucleotides that were retained in the final model. Mismatches in regulatory, spacer, and mooring sequences were determined in comparison to the corresponding sequences in Apob mRNA (as reference). (r) Pearson correlation coefficient.

