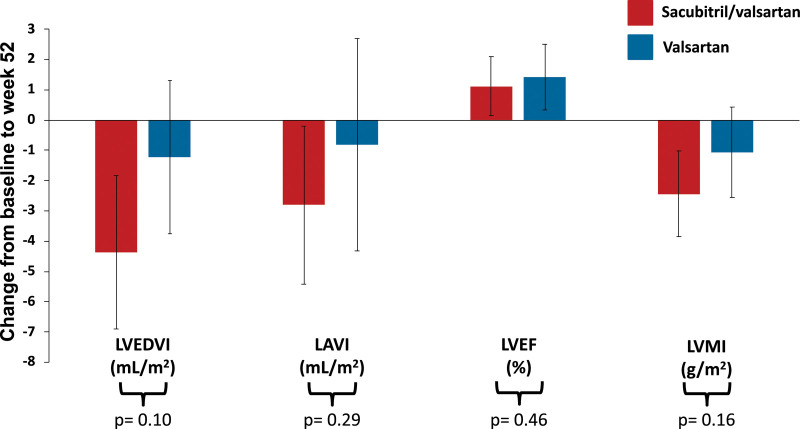
Figure 2.
Change in secondary cardiac MRI outcomes from baseline to week 52. Data presented as mean and error bars represent 95% CIs. Between-group difference calculated using a linear regression model adjusted for randomized treatment, baseline value of the outcome, use of diuretics at baseline, and time from randomization to cardiac magnetic resonance imaging. LAVI indicates left atrial volume index; LVEDVI, left ventricular end-diastolic volume index; LVEF, left ventricular ejection fraction; and LVMI, left ventricular mass index.

