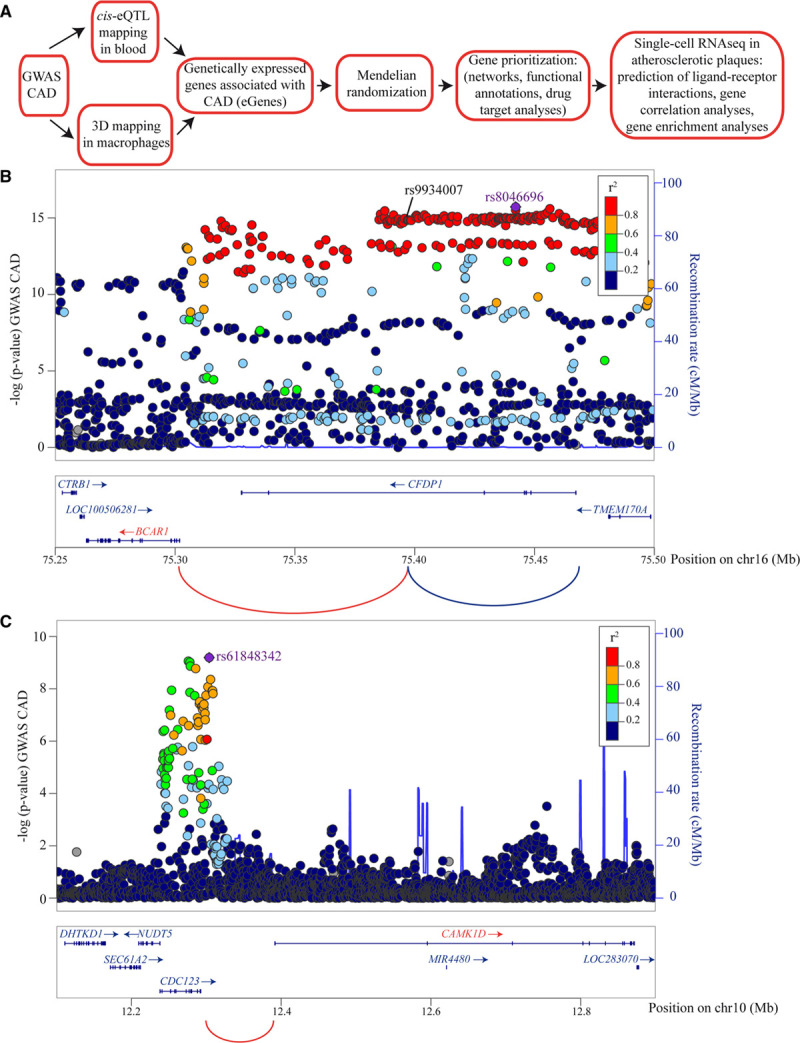
Figure 1.

Mapping the coronary artery disease (CAD)-associated genes in blood (eGenes). A, Representative scheme showing the pipeline of analyses. B, Example of 3-dimensional (3D)-mapped BCAR1 gene where rs9934007, an intronic variant in CFDP1, intersected with a promoter interacting region (PIR) that interacted with CFDP1 and BCAR1 gene promoters in macrophages. C, Example of 3D-mapped CAMK1D gene where rs61848342, an intergenic variant, intersected with a PIR that interacted with CAMK1D gene promoter in macrophages. Arcs are significant 3D genomic interactions. Genes and arcs colored in red are 3D-mapped genes and also predicted as causally associated with CAD in Mendelian randomization (MR). Genes not predicted as causally associated with CAD are in blue. eQTL indicates expression quantitative trait loci; and GWAS, genome-wide association studies.
