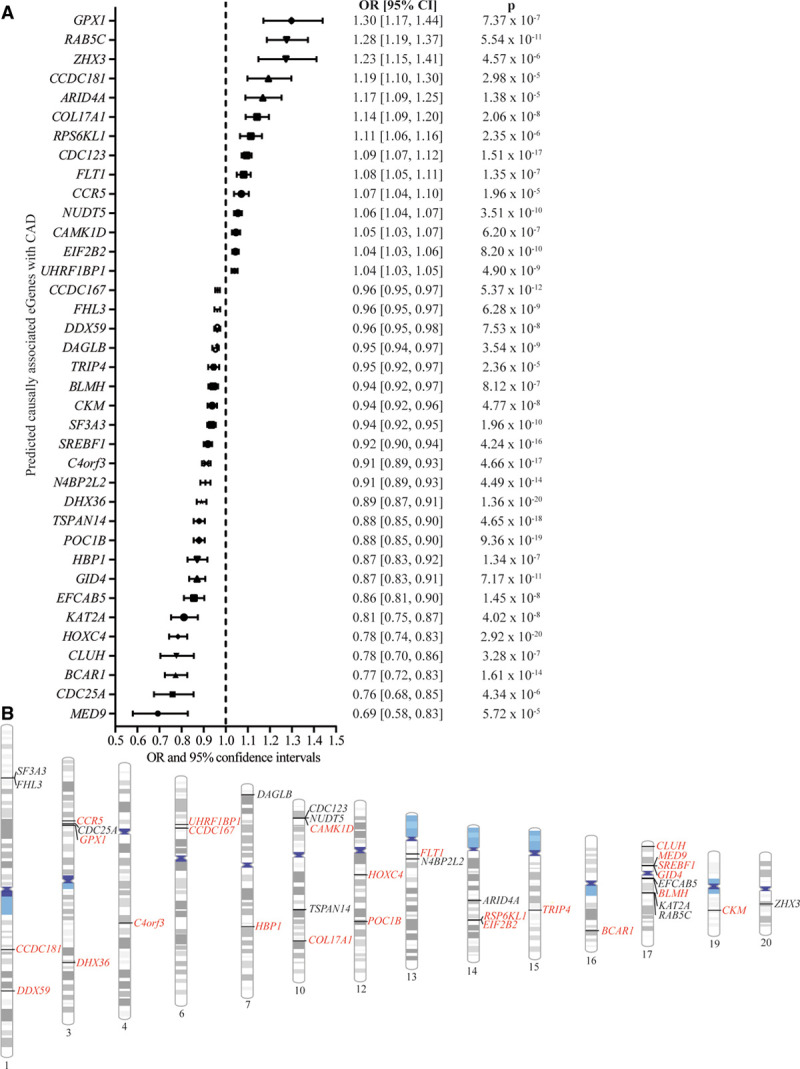
Figure 2.

Coronary artery disease (CAD)-predicted causally associated eGenes in blood and their respective loci. A, Forest plot showing the odds ratio (OR; with 95% CI) and the inverse variance weighted Mendelian randomization P value for each CAD predicted causally associated eGenes. B, Chromosome ideogram representing the loci for each CAD predicted causally associated eGenes. Genes in black were mapped by van der Harst et al,8 and the genes in red are the novel CAD predicted causally associated eGenes.
