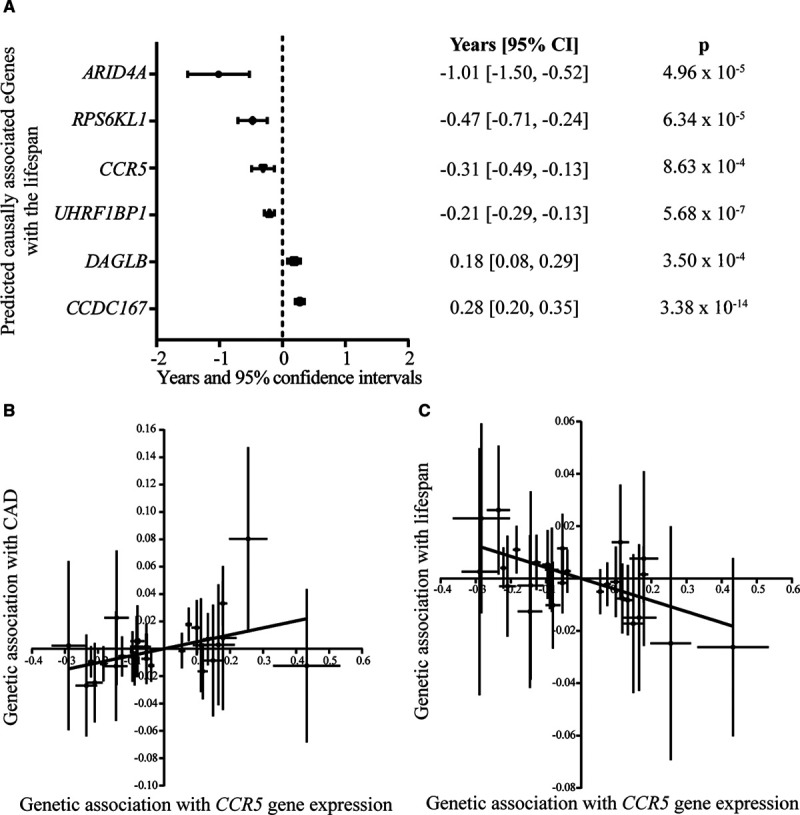
Figure 4.

Identification of lifespan predicted causally associated eGenes. A, Forest plot showing the years gained or lost for 6 lifespan predicted causally associated eGenes with their corresponding inverse variance weighted Mendelian randomization P values. B, Graph showing the genetic association of CCR5 expression in blood with the risk of coronary artery disease (CAD). C, Graph showing the genetic association of CCR5 expression in blood with the lifespan potential; each point represents an instrumental variable (gene variant).
