Figure 5.

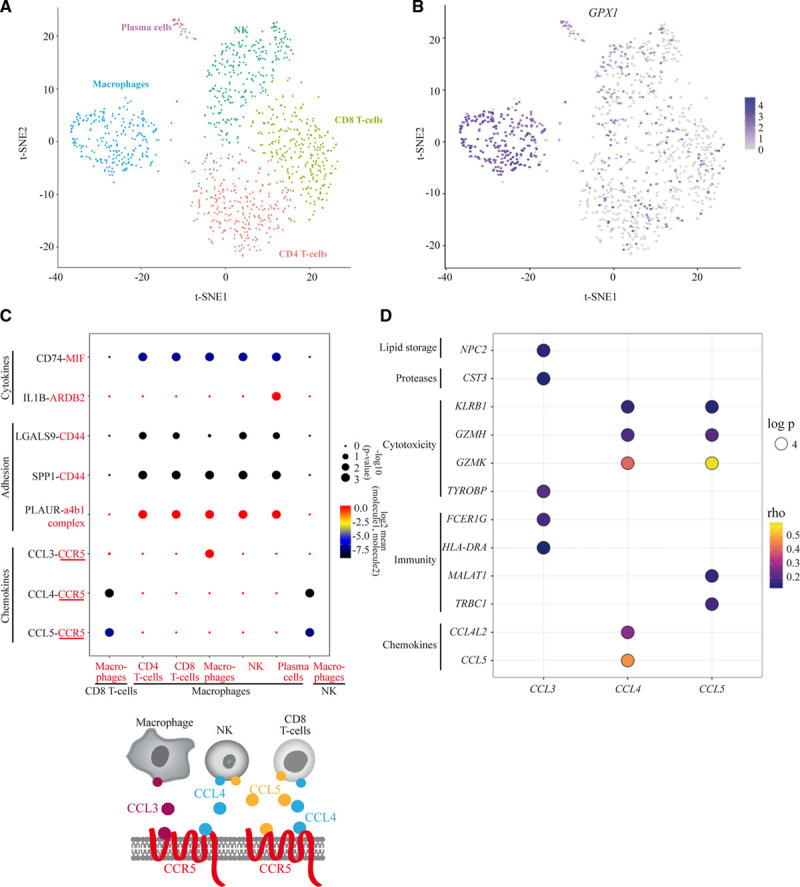
Analyses of single-cell RNA-seq data from immune cells of human atherosclerotic plaques. A, tSNE plot for immune cells from atherosclerotic plaques showing the presence of macrophages, T-CD4, T-CD8, natural killer (NK), and plasma cells. B, tSNE plot showing the enrichment of GPX1 in the cluster of macrophages. C, Ligand-receptor interactions between immune cells using CellPhoneDB.28 Ligands are in black and receptors in red. D, Balloon plot representing the correlations between CCL3, CCL4, CCL5 and genes coding for chemokines, immune, cytotoxic, proteases, and lipid storage proteins. The color of the circle indicates the ρ correlation score and the size corresponds to the log Padjusted. CCL indicates C-C motif chemokine ligand; and IL1B, interleukin 1β.
