
Figure 3.
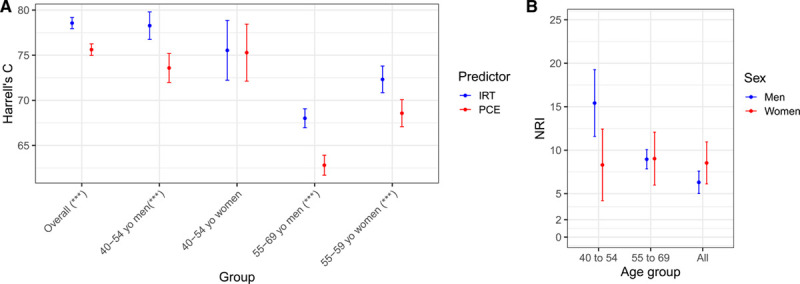
Model discrimination and net reclassification improvement for the integrated risk tool (IRT) compared with pooled cohort equations (PCE). A, Harrell’s C overall and across age-by-sex subgroups. Blue and red lines refer to IRT and PCE, respectively. Asterisks in x axis labels denote level of significance for the difference in Harrel C (***P<0.001). B, Net reclassification improvement (NRI) for the IRT compared with PCE alone across different age groups in men (blue) and women (red). The bars indicate the 95% CIs.