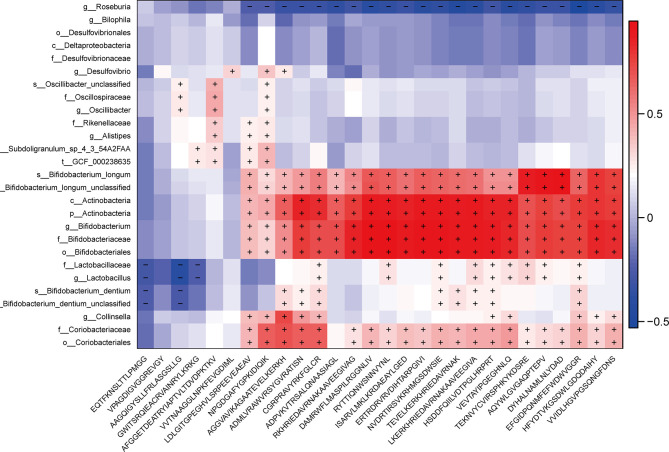
Figure 5.
Correlations between 27 potential bacterial biomarkers and 28 selected epitope biomarkers. The Spearman correlation was calculated and tested using the “cor.test” function. The right panel shows the size of the correlation coefficient, with: red representing a positive correlation; blue representing a negative correlation; and “+” and “−” in each lattice representing significant positive and negative correlations (P < 0.05), respectively.

