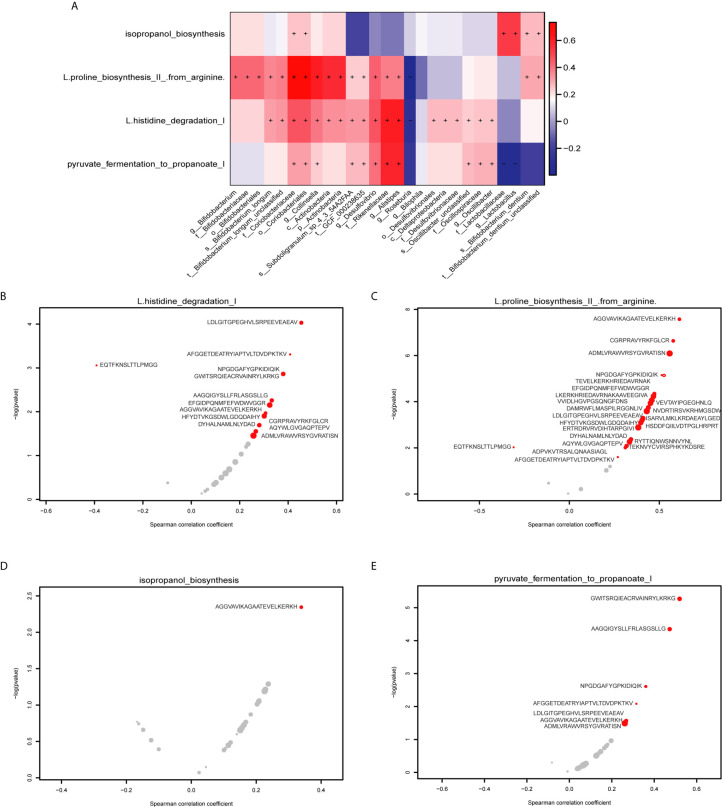
Figure 6.
Correlations between gut MES and functional pathways. (A) The heatmap shows the correlations between 27 potential bacterial biomarkers and functional pathways. The right panel shows the size of the correlation coefficient, with: red representing a positive correlation; blue representing a negative correlation, “+” and “−” in each lattice representing significant positive and negative correlations, respectively (P < 0.05). (B) Correlations between the L-histidine degradation I pathway and 13 specific epitope biomarkers. (C) Correlations between the L-proline biosynthesis II (from arginine) pathway and 23 specific epitope biomarkers. (D) Correlations between the isopropanol biosynthesis pathway and 1 specific epitope biomarker. (E) Correlations between the pyruvate fermentation to propanoate I pathway and 7 specific epitope biomarkers. The horizontal axis represents the spearman correlation coefficient, the vertical axis represents -log(pvalue), the red dot represents the marker with significant correlation, and the gray represents the insignificant. The size of the dot represents the relative abundance of the marker.

