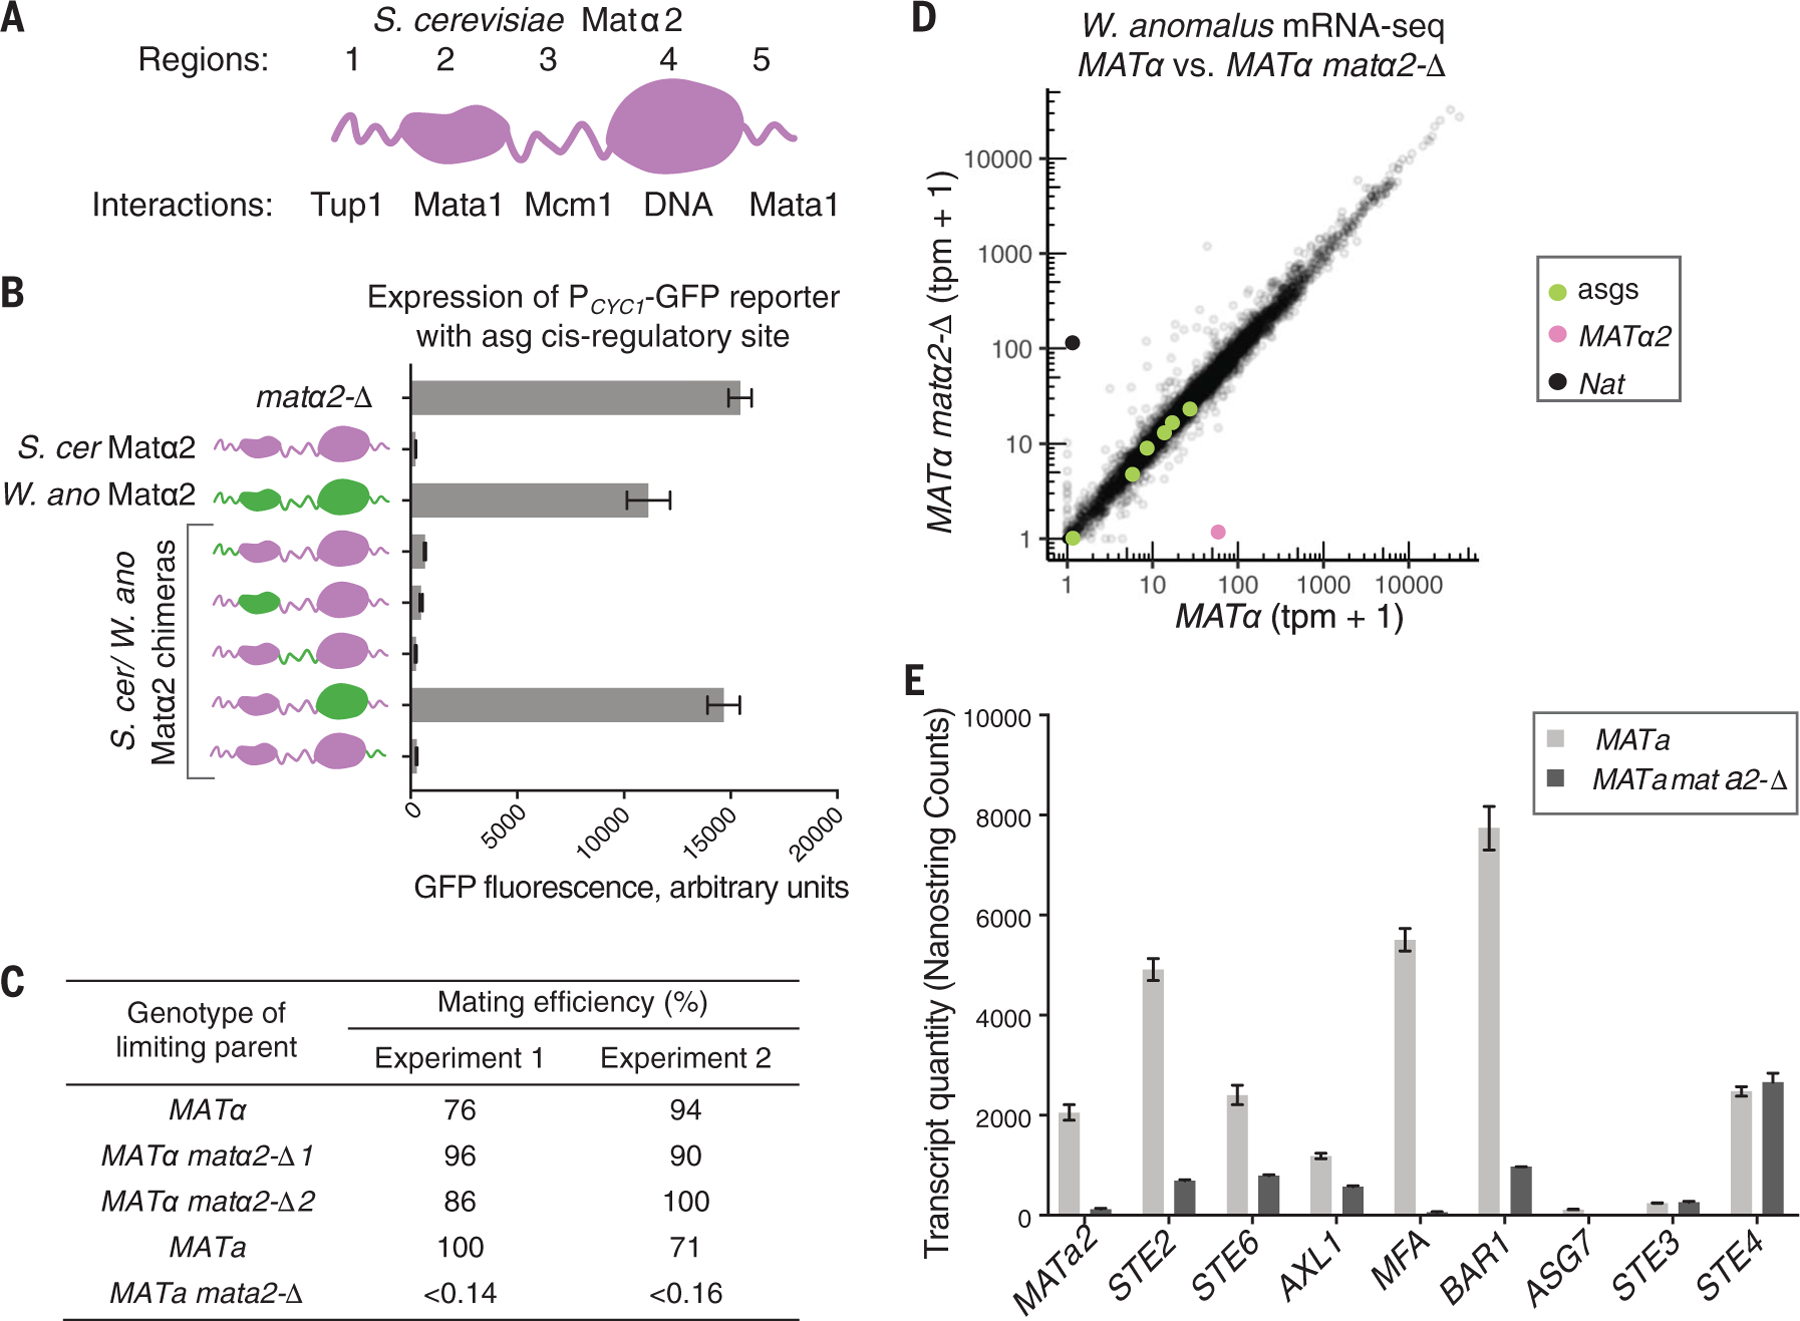
Fig. 2. W. anomalus Matα2 has functional Tup1- and Mcm1-interacting regions but does not repress the a-specific genes.

(A) The five modules of the S. cerevisiae Matα2 protein. Structural domains are shown as globular, and unstructured regions are shown as wavy lines. (B) Expression of an a-specific gene reporter in the presence of S. cerevisiae (S. cer) Matα2 (purple), W. anomalus (W. ano) Matα2 (green), and hybrid proteins (purple and green). Means and SDs of three independent genetic isolates, grown and tested in parallel, are shown. GFP, green fluorescent protein. (C) In W. anomalus, Mata2, but not Matα2, is required for a cells to mate (see supplementary text for details). (D) mRNA sequencing (mRNA-seq) (tpm, transcripts per million) of wild-type W. anomalus α cells (MATα) compared with a cells with MATα2 deleted (MATα2 matα2-Δ). a-specific genes STE2, AXL1, ASG7, BAR1, STE6, and MATa2 are shown in green. Expression of MATα2 and the marker used to delete it (Nat) are shown in pink and opaque black, respectively. Data from independent replicates are given in fig. S3. (E) a-specific gene expression levels in a wild-type W. anomalus a cells (MATa) compared with a cells with MATa2 deleted (MATa2 mata2-Δ), measured by the NanoString nCounter system (24). For comparison, expression levels of the α-specific gene STE3 and the haploid-specific gene STE4 are also given. Means and SDs of two cultures per genotype, grown and tested in parallel, are shown.
