Figure 2.
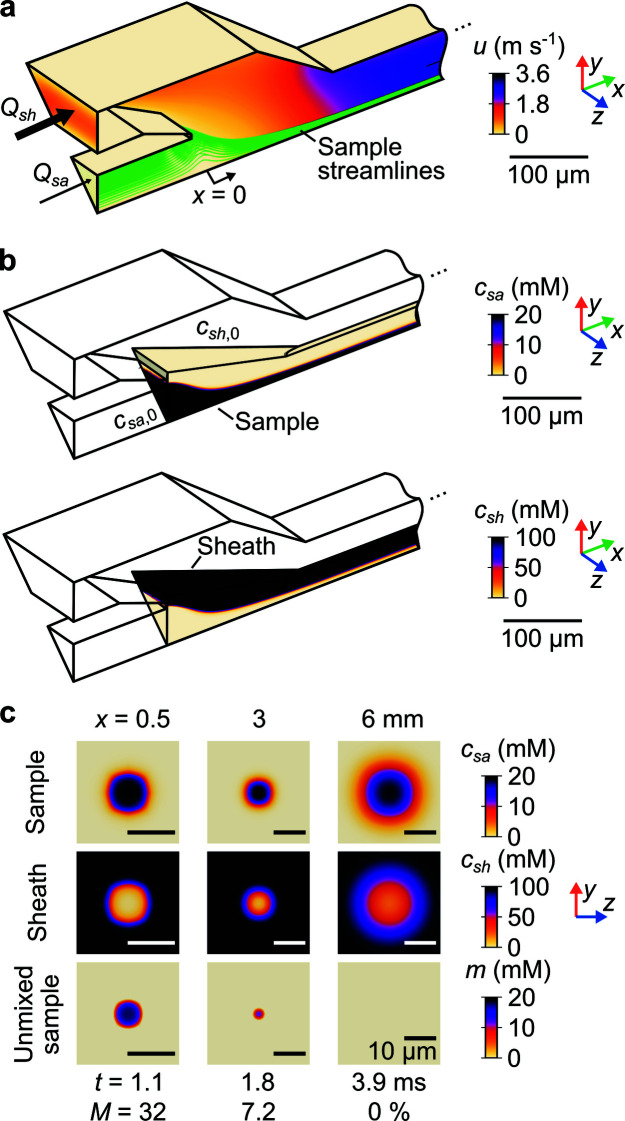
Results of the 3D numerical convection–diffusion model. (a) Velocity magnitude field u in isometric view. Sample streamlines were used to evaluate the sample residence time t. The model has 1/8th symmetry. (b) Sample c sa (top row) and sheath (bottom row) concentration fields, also in isometric view, for a subdomain of the mixer geometry. (c) Sample (top row) and sheath (middle row) concentration fields in three y–z planes. Also shown is the unmixed sample concentration m (bottom row). Each column of (c) shows an axial position x with corresponding t and depth-averaged, unmixed sample fraction M. Note that flow passages are not circular and the species iso-concentration contours are not circular for x < 3 mm (due to a square cross-sectional geometry within the chip). Downstream into the circular capillary, these contours become approximately circular. Data in all panels are for Q sa = 10 µl min−1, Q sh = 1 ml min−1, c sa, 0 = 20 mM, and c sh, 0 = 100 mM.

