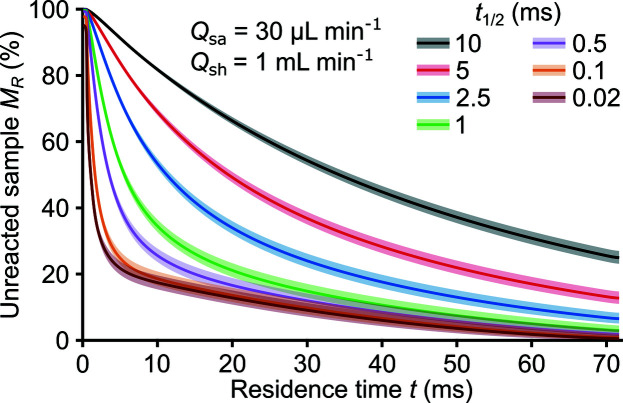
Figure 8.
Predicted depth-averaged, unreacted sample fraction M
R
versus the Lagrangian sample residence time t for varied reaction half-lives t
1/2 and fixed sample Q
sa and sheath Q
sh flow rates. The reaction studied involved ascorbic acid H2Asc and ferricyanide
 reactants and dehydroascorbic acid Asc and ferrocyanide
 products. The shaded area near the lines shows the range of possible M
R
given variations in sample and sheath species diffusivities of 10%. The second-order decay rate for these simulations was estimated as k =
 . Data are for initial concentrations of
 = 40 mM and [H2Asc]0 = 200 mM.

