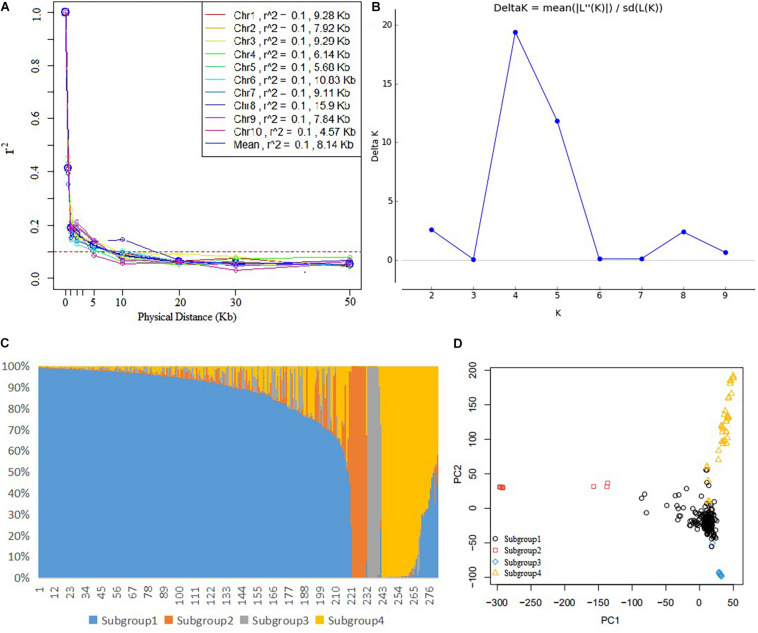
FIGURE 1.
Analysis of genetic diversity in the genome-wide association study (GWAS) panel. (A) Linkage disequilibrium decay across all 10 maize chromosomes, (B) the plot of delta K, (C) the estimated probability membership for each inbred line at K = 4, and (D) the principal component analysis plot showing four subgroups corresponding to the four subgroups by the STRUCTURE analysis.

