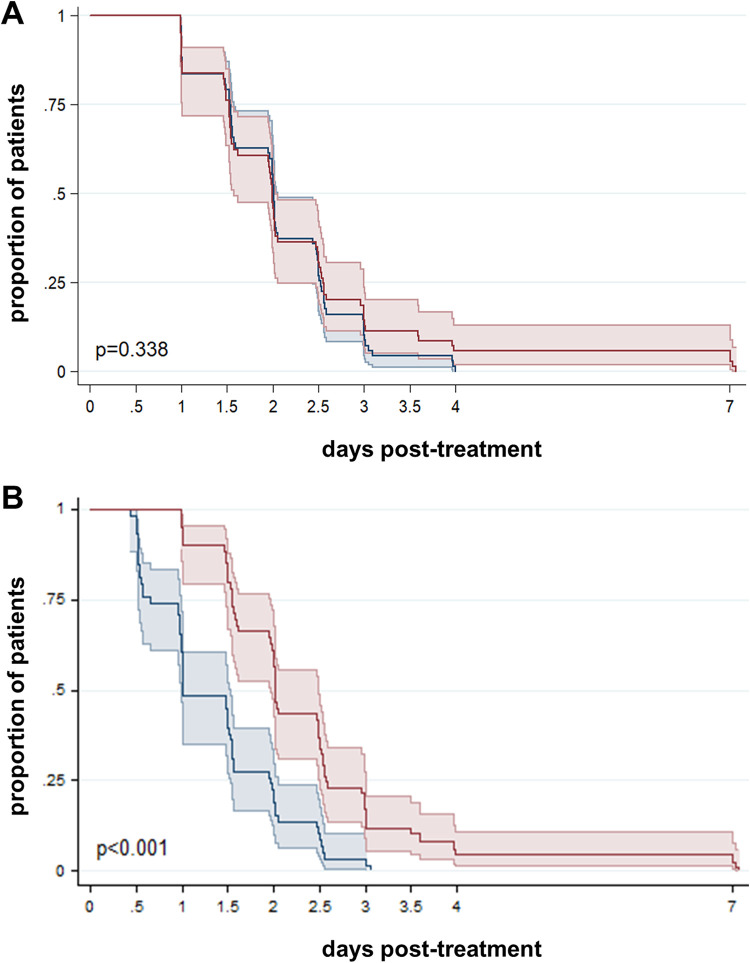
FIG 2.
Time to parasite clearance. Kaplan-Meier survival curves for total parasite clearance (A) and gametocyte clearance (B). Results are stratified by light microscopy (n = 67; blue line) and qPCR (n = 63; red line) (A) or RT-qPCR (n = 59, red line) (B). Colored areas indicate 95% confidence intervals. P values were calculated using a log rank test. One patient with no day 7 sample tested by qPCR/RT-qPCR was excluded from this analysis.

