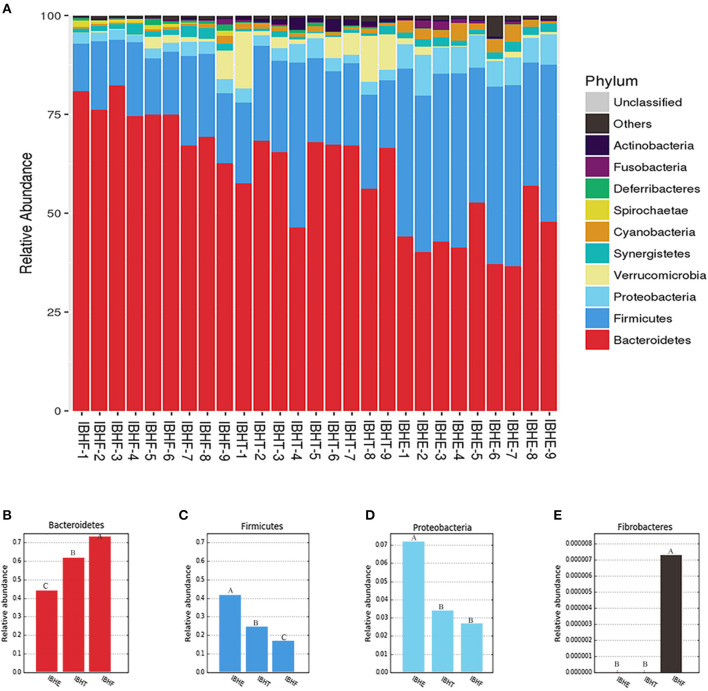
Figure 3.
Taxonomy stack distribution and abundance histograms of the dominant bacteria phyla of chickens in different growth periods. (A) Taxonomy stack distribution of the dominant phyla at 8, 20, and 50 weeks. IBHE, IBHT, and IBHF refer to “ISA Brown Hens-8 weeks,” “ISA Brown Hens-20 weeks,” and “ISA Brown Hens-50 weeks,” respectively. The top 10 dominant bacteria during different periods were classified. A distinctive color histogram represents the relative distribution of these most dominant bacteria. The names of distinct levels of phyla are shown on the right of figures, and the names of samples are under the figure. (B–E) Abundance histograms of some significant dominant phyla at 8, 20, and 50 weeks. Phyla with different superscript letters mean significant differences (P < 0.05) between groups, and different superscript letters mean extremely significant differences (P < 0.01).

