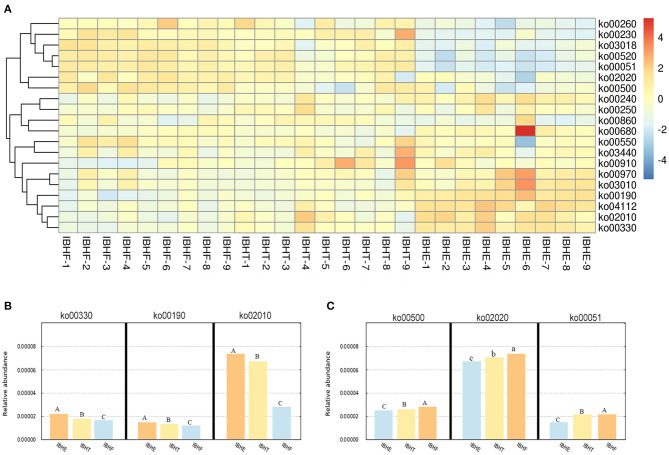
Figure 7.
(A) The heatmap of functional prediction of enriched metabolic pathways (ko) of OTUs in different growth periods. The color gradient of heatmap was from red to yellow to blue, which indicates that the metabolic pathway abundance predicted by OTUs in each sample decreased gradually. The redder the color, the more bacteria performed this function. The bluer the color, the lesser bacteria performed this function. IBHE, IBHT, and IBHF refer to “ISA Brown Hens-8 weeks,” “ISA Brown Hens-20 weeks,” and “ISA Brown Hens-50 weeks,” respectively. (B) The abundance histograms of significantly increased metabolic pathways of OTUs from 8 to 20 and 50 weeks. (C) The abundance histograms of significantly reduced metabolic pathways of OTUs from 8 to 20 and 50 weeks. Metabolic pathways with different superscript letters mean significant differences (P < 0.05) between groups, and different superscript letters mean extremely significant differences (P < 0.01).

