Fig. 1.

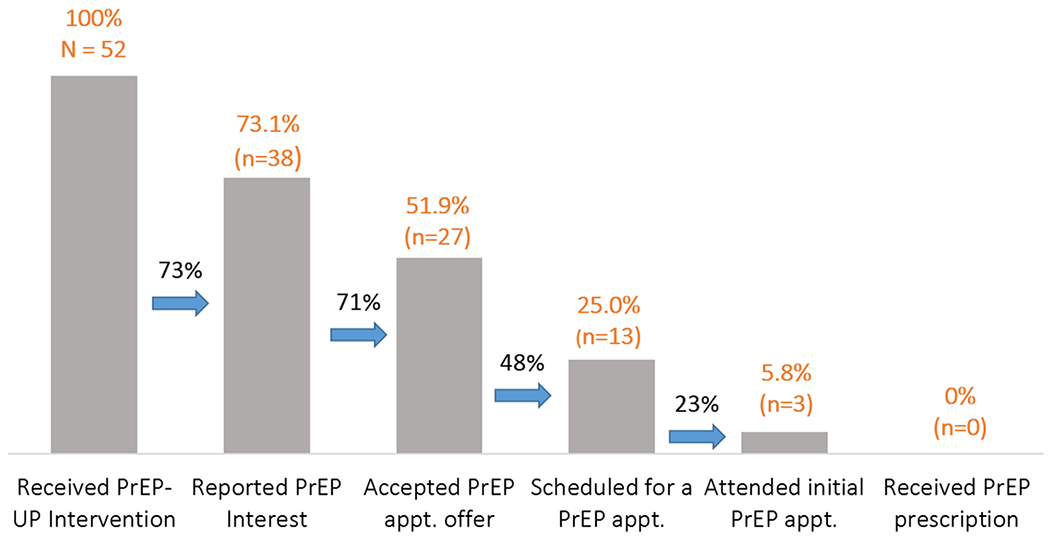
PrEP-UP Intervention Cascade. Percentages above each bar represent the proportion of the total sample (N = 52); percentages between bars represent the proportion retained at each step of the cascade

PrEP-UP Intervention Cascade. Percentages above each bar represent the proportion of the total sample (N = 52); percentages between bars represent the proportion retained at each step of the cascade