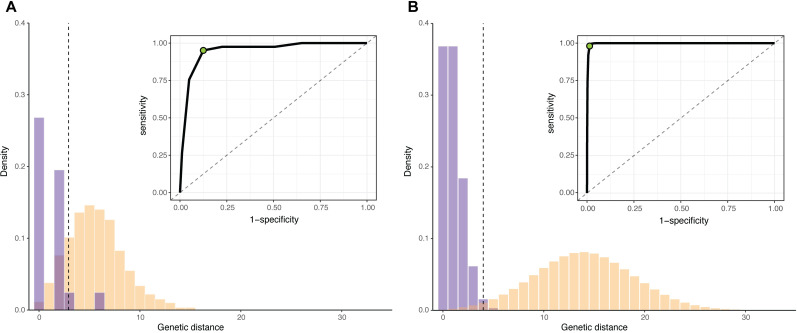
Fig 2. Determining the sensitivity and specificity of a genetic distance threshold.
(A) Empirical distribution of genetic distances for linked (purple) and unlinked (yellow) infections for 50 infections selected from early in a simulated outbreak (μ = 1 substitution/genome/generation, R = 2). Inset: receiver operating characteristic (ROC) for all possible genetic distance thresholds. Optimal threshold shown as green dot (ROC) and dashed vertical line (distribution). (B) Estimated distribution of genetic distances for linked and unlinked infections generated by the substitution rate method. Parameters and plots are as in (A).

