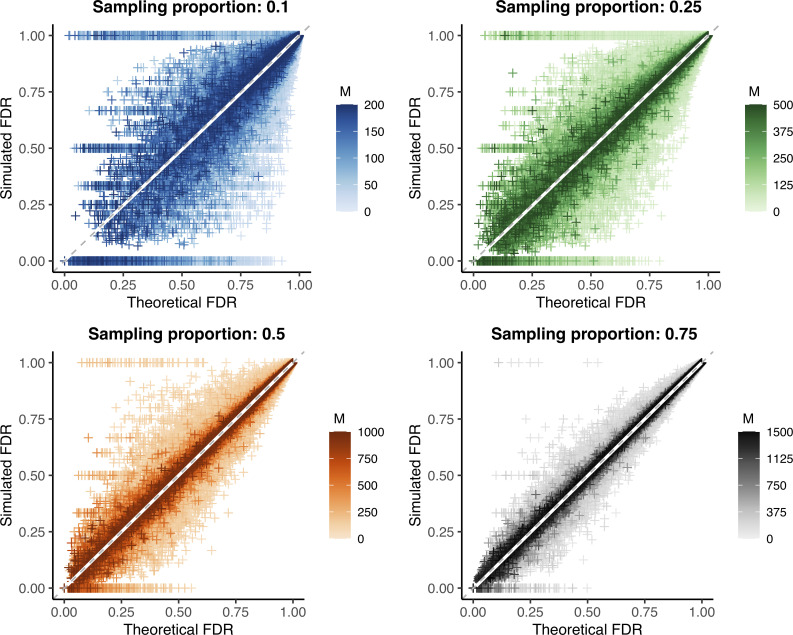
Fig 3. Predicted versus observed false discovery rate in outbreak simulations.
Theoretical versus simulated false discovery rate (FDR) for each genetic distance threshold in 10,000 simulations of varying substitution rate and reproductive number (approximately 260,000 points per plot, see Tables 2 and 3). Outbreak sizes range from 100–2000, as described in Methods. White line: smoothed conditional mean; grey dashed line: y = x line. Increasing values of the sample size (M) are plotted in darker color; because the maximum outbreak size is fixed at 2000, the maximum sample size differs for each sampling proportion. Increasing both the sample size and proportion reduces bias and error, see Tables 2 and 3.

