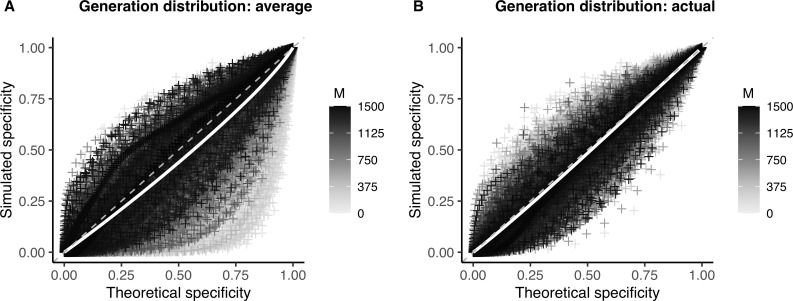
Fig 6. Effect of the generation distribution on specificity of the linkage criteria.
Theoretical versus simulated specificity for each genetic distance threshold in 10,000 simulations of varying substitution rate and reproductive number (proportion sampled = 0.75). White line: smoothed conditional mean; grey dashed line: y = x line. Increasing values of the sample size (M) are plotted in darker color. (A) Theoretical sensitivity and specificity calculated using average distribution of generations between infections from simulations (see S2 Text). (B) Theoretical sensitivity and specificity calculated using the actual distribution of generations between infections from that simulated outbreak.

