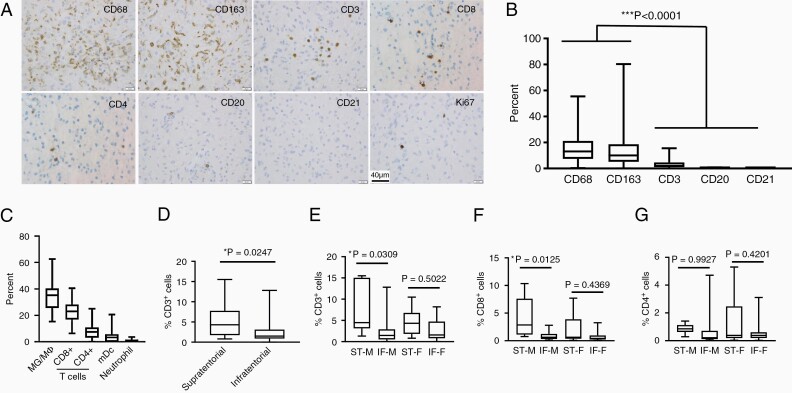
Figure 1.
(A) Representative immunohistochemistry images from the PA tissue microarray. (B) Higher percentages of CD68+ and CD163+ tumor-associated microglia/macrophages were observed relative to CD3+ T cells, CD20+ B cells, and CD21+ dendritic cells (***P < .0001 by one-way analysis of variance). (C) CIBERSORTx analysis of RNA microarray data from 82 sporadic PAs (GSE44971, n = 46; GSE50161, n = 15; GSE12907, n = 21), in which macrophage and monocyte populations (MG/MΦ), as well as CD8+ cell populations (CD8+ T cells and NK cells), were combined. The means and standard deviations for these deconvoluted results are included. (D) Percentage of CD3+ T lymphocytes was higher in supratentorial relative to infratentorial PAs as a group (*P = .0247; Welch’s t-test). (E) Percentage of CD3+ T lymphocytes was significantly higher in supratentorial compared to infratentorial PAs from boys (*P = .0309), but not girls (P = .5022). ST-M: n = 6; IF-M: n = 15; ST-F: n = 10; IF-F: n = 13. (F) Percentage of CD8+ T lymphocytes was significantly higher in supratentorial compared to infratentorial PAs from boys (*P = .0125), but not girls (P = .4369). ST-M: n = 6; IF-M: n = 13; ST-F: n = 9; IF-F: n = 12. (G) There was no significant difference in percentage of CD4+ T lymphocytes in supratentorial compared to infratentorial PAs from either boys (*P = .9927) or girls (P = .4201). ST-M: n = 6; IF-M: n = 13; ST-F: n = 9; IF-F: n = 12. ST-M, supratentorial-male; IF-M, infratentorial-male; ST-F, supratentorial-female; IF-F, infratentorial-female. P values in panels (E), (F), and (G) by Tukey’s multiple comparisons test. Immunohistochemistry for microglia/macrophages (CD68; Ventana, CD163; Cell Marque), T cells (Ventana; CD3, 2GV6; CD8, SP57; CD4, SP35), B cells (CD20; Ventana), and dendritic cells (CD21; Cell Marque) was performed, and percentage of positive cells was manually counted. Ki67 immunohistochemistry (Ventana) was performed to determine the proliferation indices. Whole slide images were scanned on a Ventana iScan Coreo (Ventana Medical Systems) at a magnification of 200× and analyzed with the companion algorithm image analysis software (Roche).

