Figure 4.
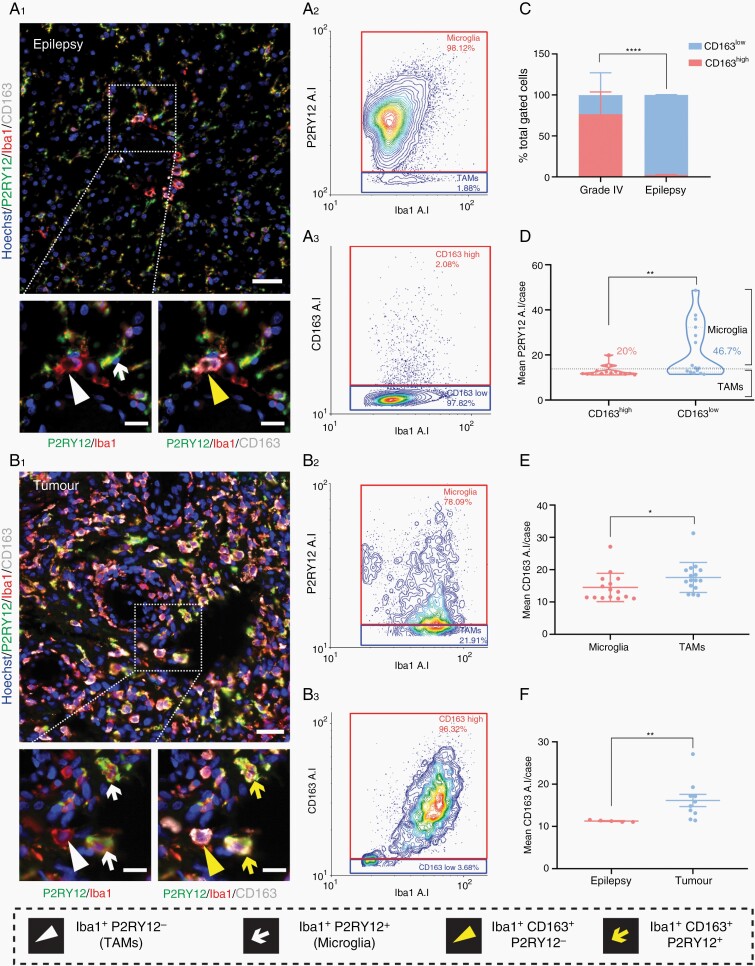
CD163 is not a specific marker for TAMs in human glioblastoma tissue and is upregulated by tumor microglia. Representative immunofluorescent triple labeling with P2RY12, Iba1, and CD163 in epilepsy and grade IV tumor tissue (A1, B1). Cell population classification by cell-specific marker expression is defined in the figure key. Scale bar 50 µm, 20 µm zoom. Corresponding single-cell resolution gating on Iba1 against P2RY12 or CD163 average intensity to define microglia and TAM populations (A2, B2), or CD163high and CD163low populations (A3, B3). Comparison of the mean percentage of CD163high and CD163low cells in grade IV and epilepsy cases using a two-way ANOVA with Tukey’s multiple comparison test (C). Data are presented as mean ± SD, ****P < .0001. Comparison of the mean single-cell average intensity, per case, of P2RY12 for classified CD163high and CD163low cells using a Mann–Whitney test, data are presented as mean ± SD, **P = .0099 (D). Comparison of mean CD163 single-cell average intensity in classified microglia (gated on P2RY12) and TAMs per grade IV tumor case (E). Comparison of mean single-cell CD163 average intensity per case of gated microglia between epilepsy and grade IV tumor tissue (F). Data are presented as mean ± SD; Mann–Whitney test, *P < .0149, **P = .0013.

