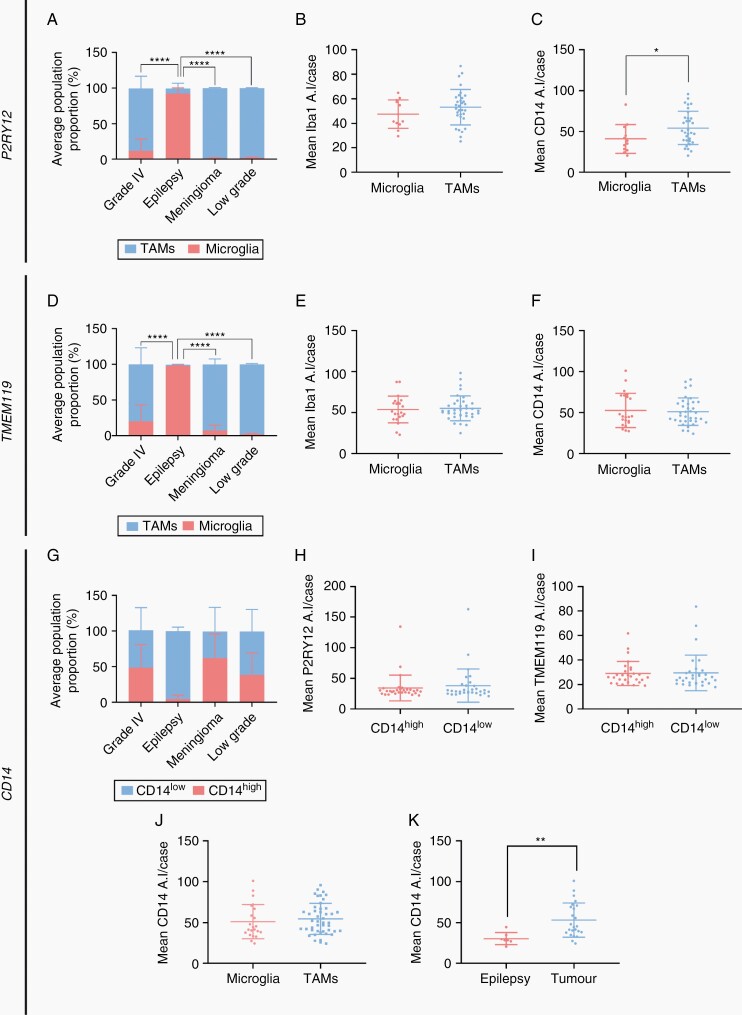
Figure 5.
P2RY12 and TMEM119, but not CD14, discriminate 2 myeloid populations in glioblastoma. Using cell-by-cell gating analysis, pooled cells from each case were gated on either P2RY12 (A–C) or TMEM119 average intensity (D–F) and classified as microglia or TAMs, respectively. Pooled cells were also gated based on CD14 average intensity (G–I) to classify cells as CD14high or CD14low. Comparison of the mean percentage of microglia and TAMs (or CD14high and CD14low cells) in grade IV, epilepsy, meningioma, and low-grade tumors using a two-way ANOVA with Tukey’s multiple comparison test (A, D, and G). Data are presented as mean ± SD, ****P < .0001. Comparison of the mean single-cell average intensity, per case, of Iba1 and CD14 for classified microglia and TAMs (B and C, E and F), and P2RY12 and TMEM119 for CD14high and CD14low cells (H and I) using a Mann–Whitney test, data are presented as mean ± SD, *P < .05. Comparison of mean CD14 single-cell average intensity per glioblastoma case in gated microglia (pooled P2RY12 and TMEM119) and TAMs (J). Comparison of mean CD14 single-cell average intensity per case of gated microglia between epilepsy and tumor tissue (K). Data are presented as mean ± SD; Mann–Whitney test, **P < .01.

