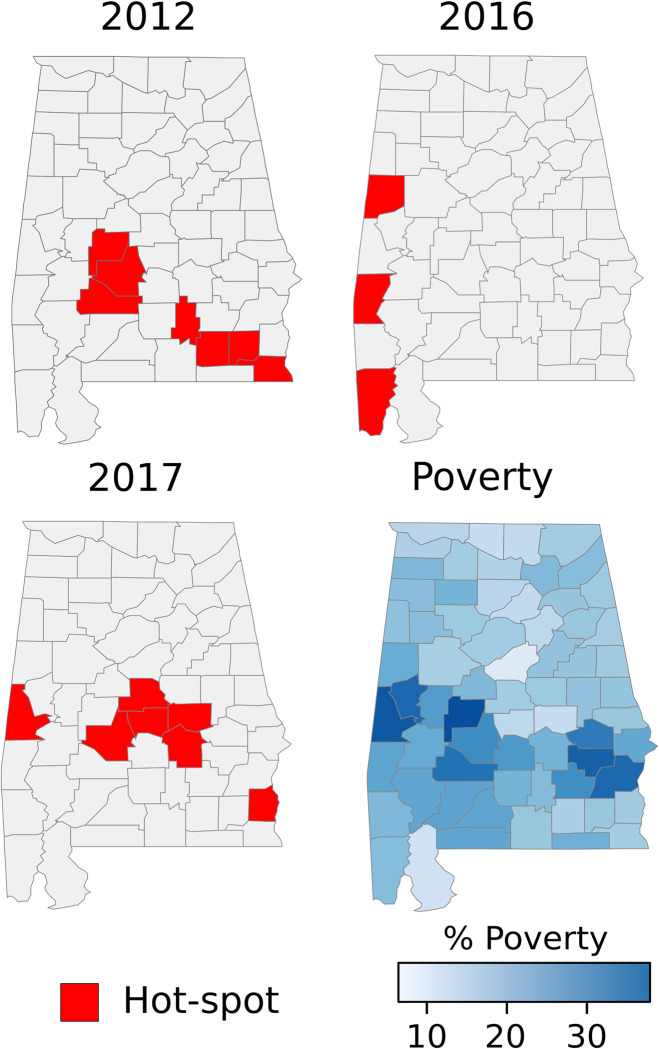
Fig 2. Hot-spots of WNV incidence at county level in Alabama in the years 2012 and 2017.
The maps show the three years when outbreaks of WNV occurred. The figure also includes the percentage of the population living in low socio-economic status at the county level based on census data. The maps were created using public available county boundaries downloaded from www.usgs.gov processed with the R software [25].

