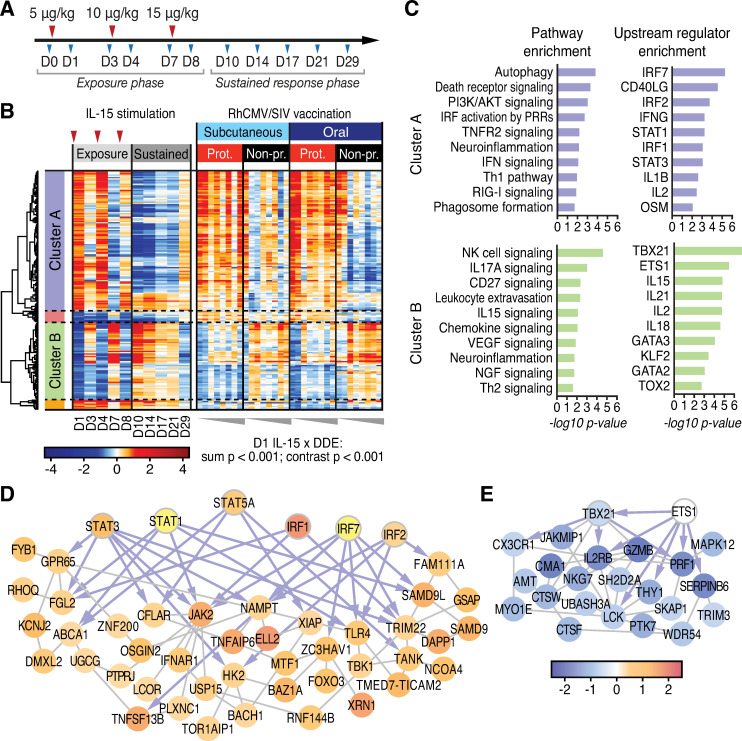
Fig 4. The IL-15 response links with correlates of vaccine protection.
A. Study design–RM treatment with rRh-Het-IL-15. Red arrowheads indicate IL-15 treatment. B. Heatmap of DDE gene correlates of protection regulated by IL-15 (IL-15 DE genes on d1 post-administration). P-values, shown below the heatmap, are highly significant for both the sum statistic and the contrast statistic differing across protection outcomes. The sum statistic is the average over time of the sum of the absolute change-from-baseline expression, and the contrast statistic is the average over time of the sum of the change-from-baseline expression of IL-15 d1 up-regulated genes minus the sum over the IL-15 d1 down-regulated response genes (see Methods). C. Ingenuity pathway and upstream regulator enrichment analyses for gene cluster A and B from panel B. D,E. De novo network of IL-15 response genes from Cluster A (D), and Cluster B (E) were constructed in GeneMania. Transcription factor nodes are indicated by thick borders with connections shown as gray lines and blue arrows, showing co-expression interactions (GeneMania) and direct transcription factor-target interactions (Ingenuity), respectively.

