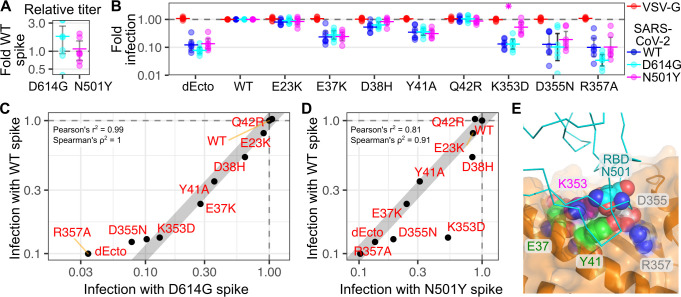
Fig 6. ACE2 variant dependencies for SARS-CoV-2 spike variants.
A) Relative titers of D614G and N501Y SARS-CoV-2 spike pseudoviruses, relative to WT. n = 7. B) Relative infectivity of WT, D614G, N501Y SARS-CoV-2 spike pseudoviruses, normalized to infectivity in WT ACE2 cells. VSV-G pseudoviruses were included as a negative control. n = 7. C) Scatter plot showing normalized infectivities of D614G (x-axis) and WT (y-axis) SARS-CoV-2 spike pseudoviruses. D) Scatter plot showing normalized infectivity of N501Y (x-axis) and WT (y-axis) SARS-CoV-2 spike pseudoviruses. The grey line in panels C and D, denote a hypothetical perfect correspondence between assays with a slope of 1. E) Structure of the RBD:ACE2 interface (pdb: 6m17), with the RBD shown as a cyan ribbon, and ACE shown as an orange cartoon with a semi-transparent surface representation. Residues of ACE variants highlighted in Figs 4E and 6D are shown as sphere representations. N501 on the RBD is shown as blue spheres.

